Turning Numbers into Narratives - The Art of Data Visualization at LexData Labs
A behind-the-scenes look at how LexData Labs transforms raw data into engaging visual stories through creativity, tech, and thoughtful storytelling by Shakib Hossain.
.png)
Turning Numbers into Narratives - The Art of Data Visualization at LexData Labs
Hi, I’m Shakib Hossain, a Creative Content Associate who turns raw data into eye-catching stories that pop! I blend tech and creativity to make visuals and videos that don’t just inform; they transform. Let’s have a look into how I make data sparkle!
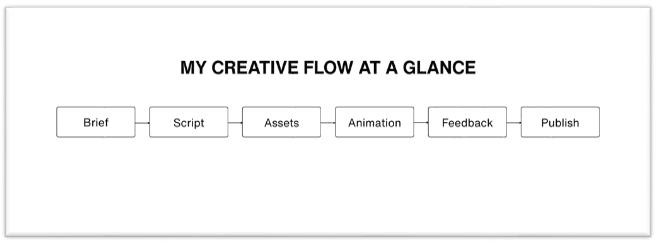
8:00 AM: Checking the Team’s Requirement - How to Speak Fluent Human-Into-Tech
I start the day by opening the morning case file: “What’s the true story behind the team’s request?” Because honestly, sometimes their ‘requirement’ looks like a cryptic code from the Matrix. I arm myself with a notebook (classic tech cliché) and begin taking notes. “Make it catchy”, “Show the culture,” “Include data stuff,” “Don’t make it boring.” Translation: “Make a magic video that makes us look like unicorns but keep it under 2 minutes.” Challenge accepted. Note to self: Buy a decoder ring.
9:00 AM: Script Crafting: The Art of Storytelling for Data Geeks
Scriptwriting begins. I try to explain company values without sounding like a robot or Shakespeare. Balanced “innovation” with “trust” and “results” without falling into the corporate jargon abyss. Adding a sprinkle of humor to keep it real, because even data needs personality. Meanwhile, my coffee-fueled, ergonomically nimble fingers keep typing away #PoweredByCaffeine.
Snack Break: 15 Minutes of Recharge
After a stretch of focused work, I often decide to take a 15-minute break for a quick snack. It’s just the right pause to recharge, cheer up, and get a little boost of energy before diving back into the next task. A short reset like this always makes the rest of the day feel more productive and balanced.
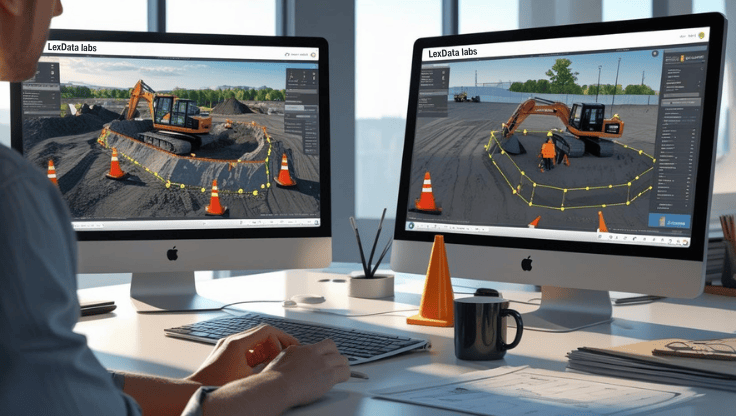
10:15 AM: Gathering Assets: Image, Icons & the Hunt for Perfect Visuals
Next mission: Collect images, icons, and create visualizations strong enough to hold the viewer’s attention. Downloading icons felt like hunting for the perfect puzzle piece, so many options, but none fit the brand's vibe until everything clicked. I figure animation software sometimes behaves like my cat: willful and mysteriously sluggish.
Spoiler: patience is not a myth; it’s a survival skill.
11:30 AM: Animation, Visualization & Graphics: Making Data Dance
I pull up my tech wizard hat to animate charts that tell a story instead of making viewers go, “Huh?” This makes visuals interactive; not literally clicking screen in video, but the kind that feels alive. Storytelling + Communication = the secret sauce. Felt like a digital Picasso, except with more pixels and fewer paintbrushes.
Lunch Break: A Little Adventure
Lunchtime isn’t just about eating; it’s about exploring. Instead of sticking to the usual spot, I try to step out once in a while and check out a new place. A short walk, a fresh atmosphere, and a different flavor on the plate makes the break feel like a mini adventure in the middle of a busy workday. It’s surprising how something as simple as lunch can reset the mood and bring a spark of energy back to the desk.
3:00 PM: The “Present to Seniors” Gauntlet
Time to show my masterpiece to the senior team. Brace for impact! This is where the real test begins because feedback is like software updates: never quite perfect, always demanding more CPU power (in my case, mental energy). First round was a classic: “We love it but… can we try something else?” AKA “Make the unicorn sparkle more, but not too much.”
3:45 PM: Iteration, Patience & The Slowly Melting Feedback Iceberg
I start updating the video, layer by layer, feedback. Each revision is like debugging a code; fixing one bug, finding two more. But here’s the tech secret: after enough tweaks, seniors start nodding and smiling, eyes saying, “Okay, this one might actually work!” Honestly, it feels like winning a marathon, except the finish line keeps moving.
Reminder: patience.exe is running.
4:15 PM: Final Version Ready: Showtime for Social Media
Finally, I managed to hit the “Export” button on the final version. Watching the progress bar feels like a countdown to launching a spaceship, so much hope, so much sweat invested!
Now for the grand finale: I post the piece on social media, knowing it will reach the right audience. With LexData Labs, every view, click, and share finds the right audience. The data doesn’t just float in the endless sea of memes and cat videos; it lands exactly where it’s meant to, creating real impact. Watching the engagement roll in is like seeing all the pieces of a puzzle snap perfectly into place; it proves that with the right tools, creativity always wins
4:50 PM: Backup & Pack-Up
Done - but not quite. I save the video in multiple safe locations because losing this would be like dropping Wi-Fi in the middle of a great movie night. Finally, I wrap up my day, recharge the brain cells, and gear up for tomorrow. Every day is a new adventure!
Every video I create is a small experiment, a chance to see how visuals can turn complex data into something people actually understand. With each project, our toolkit grows sharper, our stories get clearer, and our impact gets bigger. That’s the art and science of data visualization at LexData Labs: constantly learning, iterating, and transforming numbers into narratives that truly resonate.
View related posts

Inside LexData Labs: How AI Engineers Shape Tomorrow’s Models
A day in the life of an AI engineer at LexData Labs, building ethical face detection systems with Claude, teamwork, and a splash of humor and tea.

Start your next project with high-quality data
