

Industries · 6 min read
AI crop analysis in the greenhouse, catching tomato disease before it spreads down the row
Lesions boxed by disease with a healthy class, a question of the footage about how far a patch spread since last week, and a model that turns with the season.
Summary
This post puts fixed cameras over tomato rows in a greenhouse and describes disease detection as lesions boxed by disease alongside a healthy class, with a question of the footage to see how far a patch has spread. It concludes that the season is the drift to plan for, and that the scout's weekly walk is the check the model is measured against. It is for growers and agronomy teams.
Rob Hickey · Chief AI Officer · Sep 26, 2026
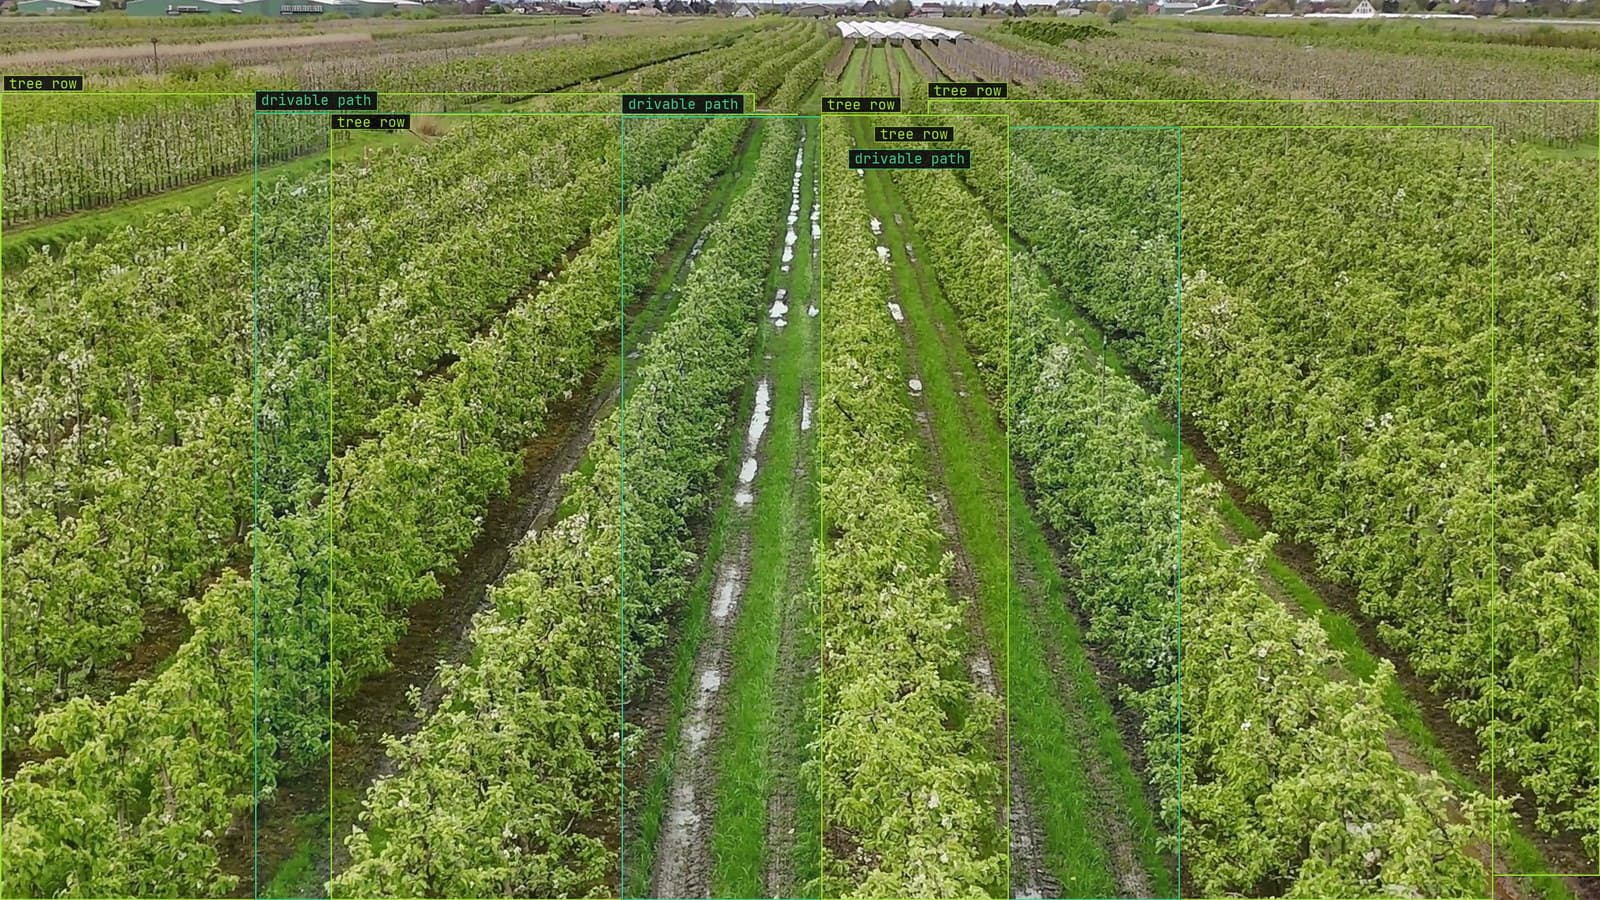
Orchard tree rows and drivable paths, from a customer tractor camera
The scout walks row K of the tomato house on Tuesdays. On a Tuesday in July the plants at bay 6 have a few brown rings on the lower leaves, the kind that early blight starts with, and the scout pegs the string above the plant so the sprayer knows where to go. By the following Tuesday the rings are three bays further down the row, because a week is a long time in a warm house and nobody walked row K on Thursday.
The cameras on the truss rail have been looking at row K every day.
Lesions are boxed by disease, and healthy is a class of its own
The model is a detector, and the classes are the diseases the house actually gets: early blight, leaf mould, blossom end rot on the fruit, and a healthy class. The healthy class is the one teams leave out and regret, because without it the model has never been shown the boundary between a normal leaf and a sick one, and it finds disease on every blemish in the house.
The boxes are tight on the lesion, not on the plant. A box around a whole truss teaches the model that trusses are blight, and a box around the ring teaches it what blight looks like. You type the disease names once, Lexi proposes the boxes on frames from the rail cameras, and a person checks them. On this job the person is usually the scout, who has been telling early blight from leaf mould by eye for years, and whose corrections at labeling are where that eye gets written down.
Blossom end rot is the awkward one. It is on the fruit, it covers a good part of it, and the box is large where every other box is small. The label guide says so, and the reviewer holds to it.
A rail camera sees the row every day, and the scout still walks it on Tuesday
The cameras are the fixed ones the house already has on the truss rail, sampled about every two seconds, one stream per camera and every camera watched in parallel. Row K is looked at on Wednesday, on Thursday, and on the Sunday nobody is in.
The scout's Tuesday walk does not stop. It becomes the reference the model is checked against: the plants the scout pegs and the plants the model boxed, compared on the same day, and the ones they disagree on going back for a look. When the scout and the model part in a consistent direction, that is the number to watch, before any accuracy figure on a dashboard moves.
The crop health and disease detection use case runs on the same idea outdoors, from a drone or a tractor camera, with the same classes and the same person checking.
A VLM answers how far the patch spread since last week
Detection produces boxes. What the grower wants is an answer: is the blight at bay 6 spreading, and how fast. That is a question of the footage, and LexInsight answers it by looking at the frames, the way a vision language model, a VLM, reads a picture and replies in words. "Which bays in row K show early blight, compared with last Tuesday" comes back with the bays, the frames, and the boxes from both weeks side by side.
The answer is only as good as the boxes underneath it. A VLM asked about frames the detector got wrong will describe the wrong frames fluently, which is why the detection is checked first and the question comes after.
Asking the question changes nothing about the model.
The alert reaches the grower with the frame, per bay, once a day
The rule is a sentence: early blight in any bay of the tomato house, high, one alert per bay per day. It is approved before it goes live, and what arrives is the frame with the lesion boxed, the row and the bay, in Slack or by email, at 7 am when the grower is planning the day's spraying. A second alert on the same bay the next morning, with the box larger, is the spread the scout used to find on Tuesday.
The cooldown is per bay for a reason. Blight in one bay is a spray. Blight in a new bay every morning is a ventilation problem, and that is a pattern a person reads from a week of alerts.
The season turns and the model has to turn with it
The failure that arrives slowly is the calendar. The model was trained on July frames: high sun through the roof, plants at waist height, leaves spaced. By October the sun is low and throws the truss shadows across the leaves at 4 pm, the plants are at head height, the canopy is dense, and the lower leaves the blight starts on are in shade the July frames never showed. Nothing was changed, which is why nobody looks.
The drift catalog calls this the season turned: a slope rather than a step, with the same plants and the same disease under different light. The tell is the scout's Tuesday walk drifting away from the model's boxes over weeks, and the fix is the frames the model doubted in September, labeled by the scout and folded into the version that runs through winter.
LexData takes the crop model through its whole life. You type what to look for, Lexi puts a box on every frame, and a person checks each label before anything trains on it. The model then watches the rail cameras the house already has, in the cloud, on your servers, or on a runner beside the recorder. Frames it is unsure of come back to a person, the corrections retrain it, and the new version replaces the old one with no downtime. Across the agriculture work we run that is 80k+ image annotations in production, most of them checked by someone who could name the disease from the doorway.
My own view is that nobody should print a yield-loss percentage for a system like this, and I distrust the ones that get printed. The number that is real is the bay count: how many bays the blight reached this season before the sprayer did, against last season. The scout has that number on the pegs.
See it on your own footage.
Start with your footageMore in Industries
Industries · 6 min read
Ceramic defect detection for hairline cracks a fixed-rule camera cannot learn
Edge chips, hairline cracks and pinholes on the tile line after the kiln, masks where the area sets the grade, and the new glaze as the day to relabel.
Esdras Ntuyenabo · Sep 26, 2026
Industries · 6 min read
Chocolate box inspection with a camera over the tray line
Each piece boxed by type, a plain check against the box template, damage as its own class, and the new spring assortment as the day the labels go stale.
Stephen Biswas · Sep 26, 2026
Industries · 7 min read
Computer vision inventory monitoring from a frame every few minutes
A shelf camera sampled every few minutes, each facing boxed and counted, a record per detection, and an alert when a facing stays empty past the hour.
Sheikh Srijon · Sep 26, 2026