

Industries · 6 min read
How to detect solar panel failure with computer vision, snow, soiling and hot spots panel by panel
Each module as its own outline from a drone pass, snow and soiling on the visible frames, hot spots on the thermal ones, an alert per string to the O&M tech.
Summary
This post takes a drone over a utility-scale array in January and labels each module as its own outline, so snow and soiling are found on the visible pass and hot spots on the thermal pass, joined by the module and reported per string. It concludes that the first winter is the season the model built in summer has to be retrained for, and that the winter frames are the ones to keep. It is for solar operations and maintenance teams.
Sheikh Srijon · GTM Lead · Sep 24, 2026
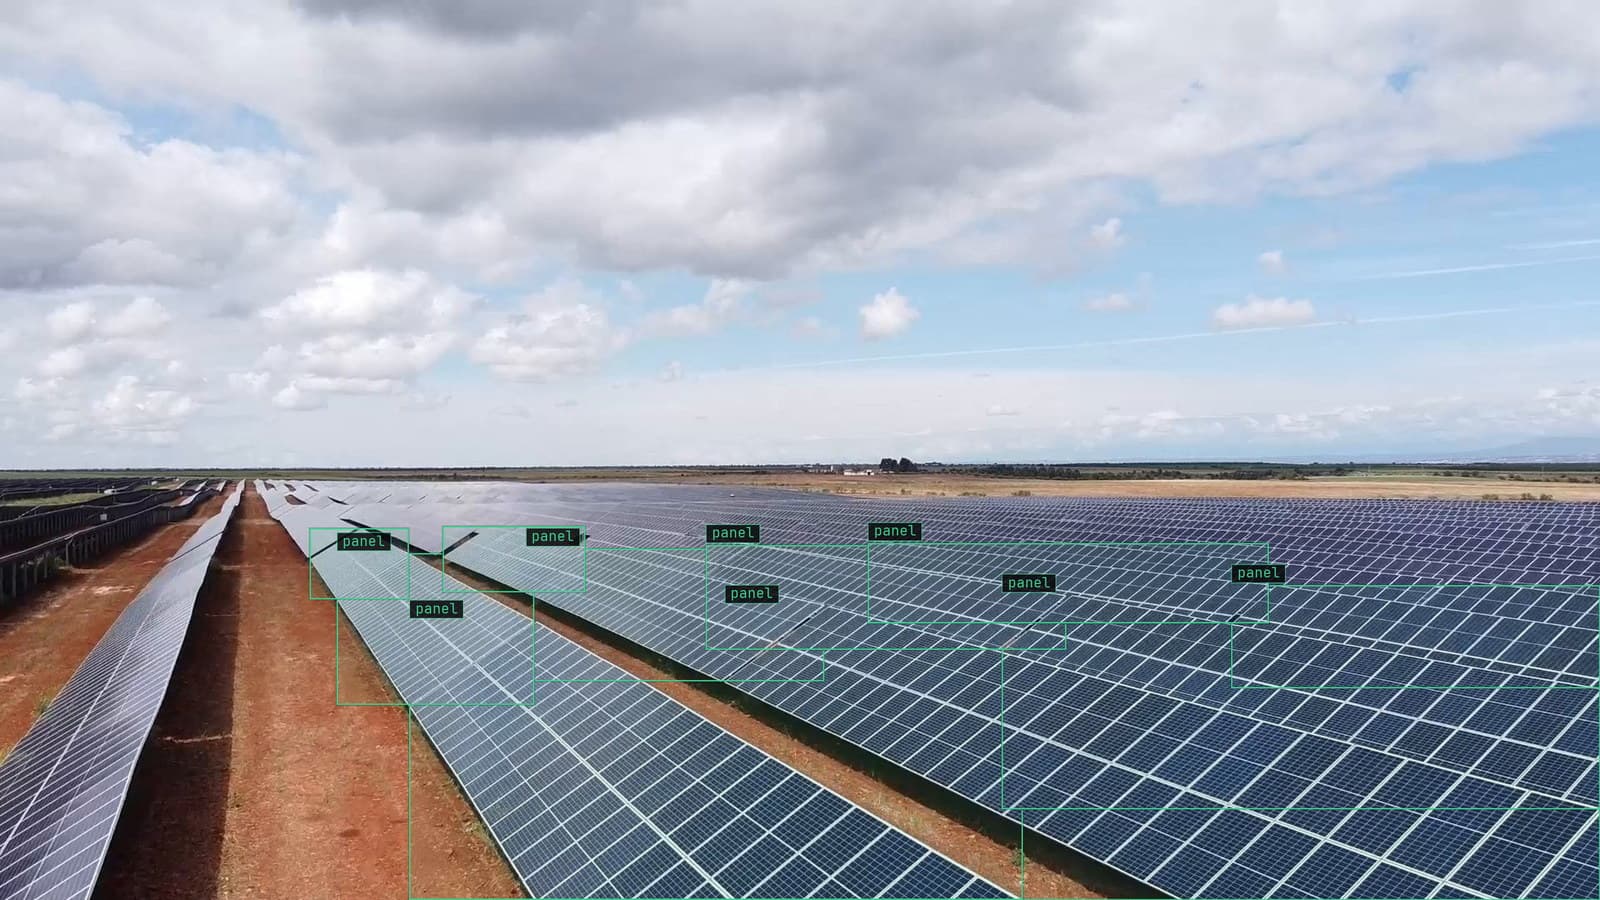
Drone pass along a solar farm, panels boxed across the rows, from a customer drone survey
On a January morning the operations tech at a utility-scale array opens the inverter dashboard and sees one string producing less than the strings either side of it. The dashboard cannot say why. It could be snow that slid off the neighbours and stayed on this one, soiling from the track the tractor uses, a bird's contribution on one cell, or a module with a failed bypass diode running hot. Each has a different fix, and finding out which means a truck, a walk down the row and an hour.
A drone pass over the array, one in visible light and one thermal, answers the question for every string at once, provided the labels are drawn per module.
Each module is its own outline, because the answer is per module and per string
The array is a grid of modules in rows, and the dashboard's unit is the string, a set of modules wired together. So the model's unit has to be the module: each one as its own outline on the frame, an instance rather than a class. That way the snow on it, the soil on it and the heat in it can be tied to a position in the row, and from the position to a string.
A box per module works on a flat frame taken straight down. Off the vertical the modules are parallelograms and a box on one includes the edge of the next, which is why the label is an outline. You type the class once, Lexi proposes the outline on every module across the pass, and a person checks the row ends and the modules under the tracker motors where the proposals go wrong. The verification pass is short on an array, because the modules are identical, and it matters because a mis-drawn outline puts one module's snow on its neighbour's record.
Snow and soiling are found on the visible pass as a share of each module
On the January visible frames the question per module is how much of it is covered and by what. Snow is a bright region on the module's outline; soiling is a darker band, usually along the bottom edge where rain leaves it, or a streak from the track side. Both are regions inside the module outline, and the output per module is the share of its area covered.
That share is what the alert is written on. A string with most of its modules mostly covered is a string that is under for a reason the crew can fix with a brush or by waiting for the thaw, and the frame shows which. My view is that the snow and soil regions should be labeled on the visible pass only, with the module outline copied across to the thermal frames rather than drawn twice. The visible frame is where a person can see the edge of the snow.
Bird droppings on a single cell can shade that cell enough to heat the whole module, which is why the smallest soil patch on the pass is the one the crew asks about first.
Hot spots are found on the thermal pass, and the two passes meet at the module
The thermal pass answers the other half. A module that is hot all over is a module with a fault; a single hot cell is a diode or a crack or the bird; a hot junction box is a connection. Each is a box on the thermal frame, inside the module outline carried over from the visible pass, and the module ID joins the two. The string that was under on the dashboard has a module with a hot cell and no snow, and the tech knows before the truck moves that it is a module swap rather than a brush.
The predictive maintenance for grid assets use case makes the point about the quantity: the prediction is a rate, and a rate is the same thing measured twice. A module that was warm on the autumn pass and hot on the January one is degrading, and only per-module records across passes show it.
The alert is per string, to the tech, with the frame attached
The alert is a rule written as a sentence, with a severity and a cooldown, approved before it goes live. A string with a hot module is a maintenance ticket and goes to the operations tech's Slack with the thermal frame, the module outlined and the string named. A string under snow is routine and goes on the morning list with the visible frame. The cooldown is a day, because a pass is a day, and the same string does not need reporting twice from one flight.
Across the energy work we run, that alert path, pointed at grid assets, is what produces 21,000+ hazard detections per month, each one arriving as a frame with a box on it rather than a row on a dashboard.
The first winter is the season the summer model has to be retrained for
The model was built on passes flown in August, when the array was clean, the sun was high and the modules were a uniform dark blue. In January the sun is low, the row in front throws a long shadow across the bottom of every module in the row behind, snow has flattened the contrast the outlines relied on, and the thermal frames have a colder sky and a different range. Nobody changed anything on the array. The drift catalog calls this the season turned, and on a solar array it is as predictable as the calendar.
The signal is the correction rate at review. When the tech is correcting module outlines on the January pass and was not on the October one, the January frames are what the next version needs, and the queue has already collected them. Keep them. A model that has seen one winter is in a different position from one that has seen none, and the second winter is mostly the weather.
LexData takes the array model through its whole life. You type what to look for, Lexi puts an outline on every frame, and a person checks each label before anything trains on it. The model then runs on each pass as it lands, in the cloud, on your servers, or on a runner beside the recorder. Frames it is unsure of come back to a person, the corrections retrain it, and the new version replaces the old one with no downtime. The shadowed January modules are what the spring version learned from.
The dashboard still says which string, and the frame now says why
The inverter dashboard is unchanged. It still flags the string that is under, and the tech still opens it first thing on the January morning. What sits beside it now is the frame from the last pass, with that string's modules outlined and whatever is on them or in them marked, so the drive out is to swap a module rather than to find out whether one needs swapping.
See it on your own footage.
Start with your footageMore in Industries
Industries · 6 min read
AI visual inspection as the nondestructive testing step a camera can take over
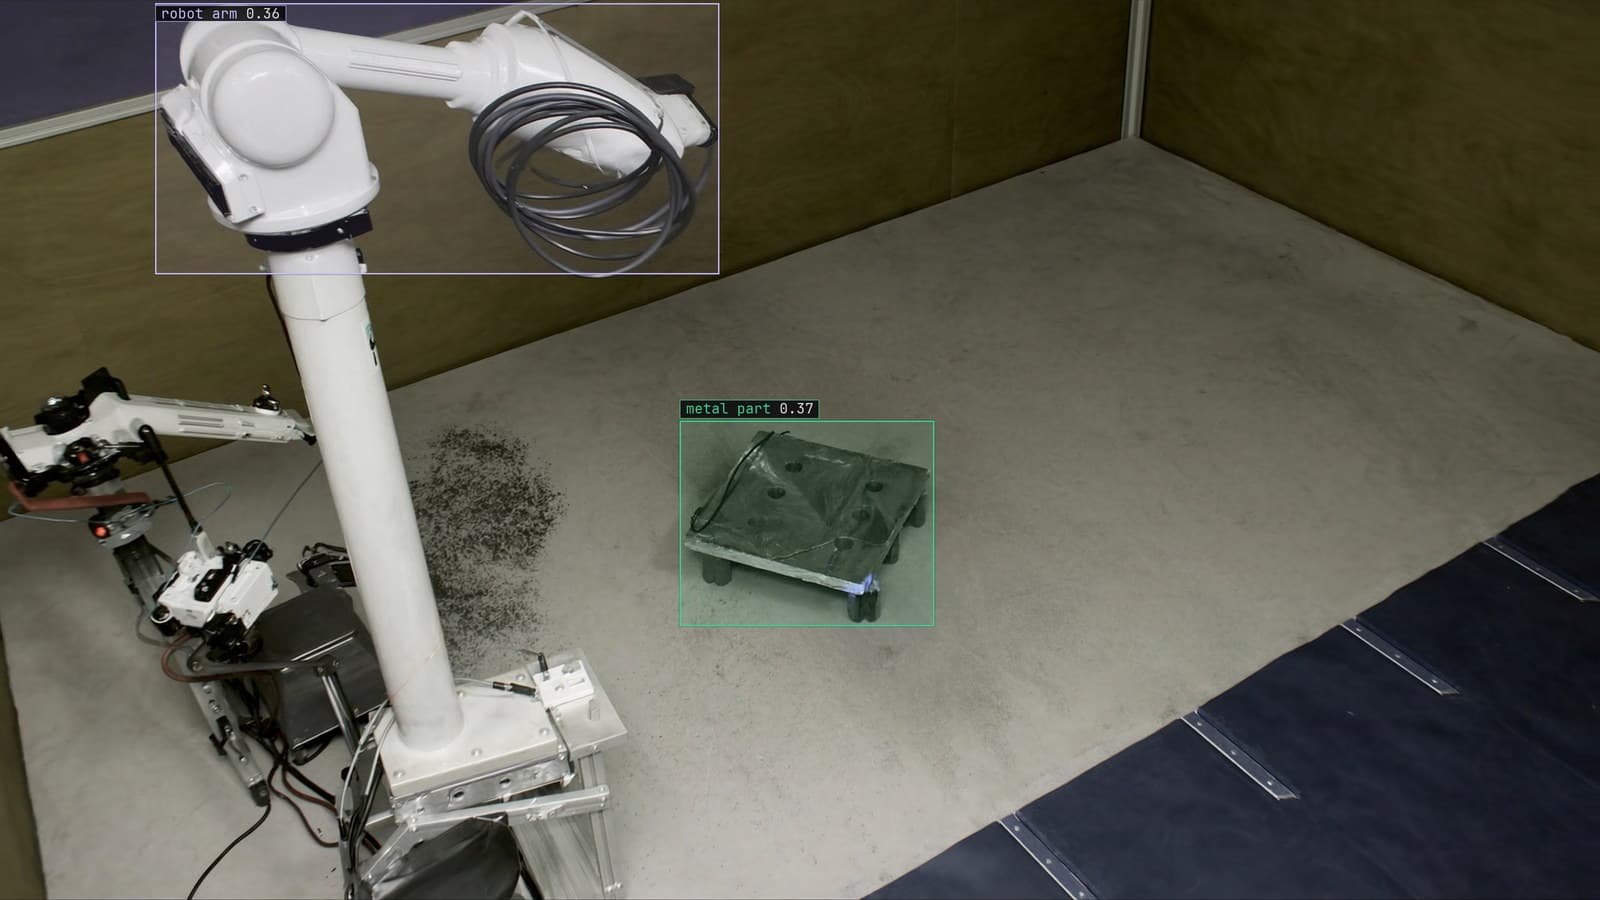
Visual testing is the first NDT gate, its acceptance criteria are already written, and a camera can apply them to every weld instead of one in twenty.
Rob Hickey · Sep 24, 2026
Industries · 6 min read
Appearance inspection systems that judge scratches, chips and burrs the same way on every shift
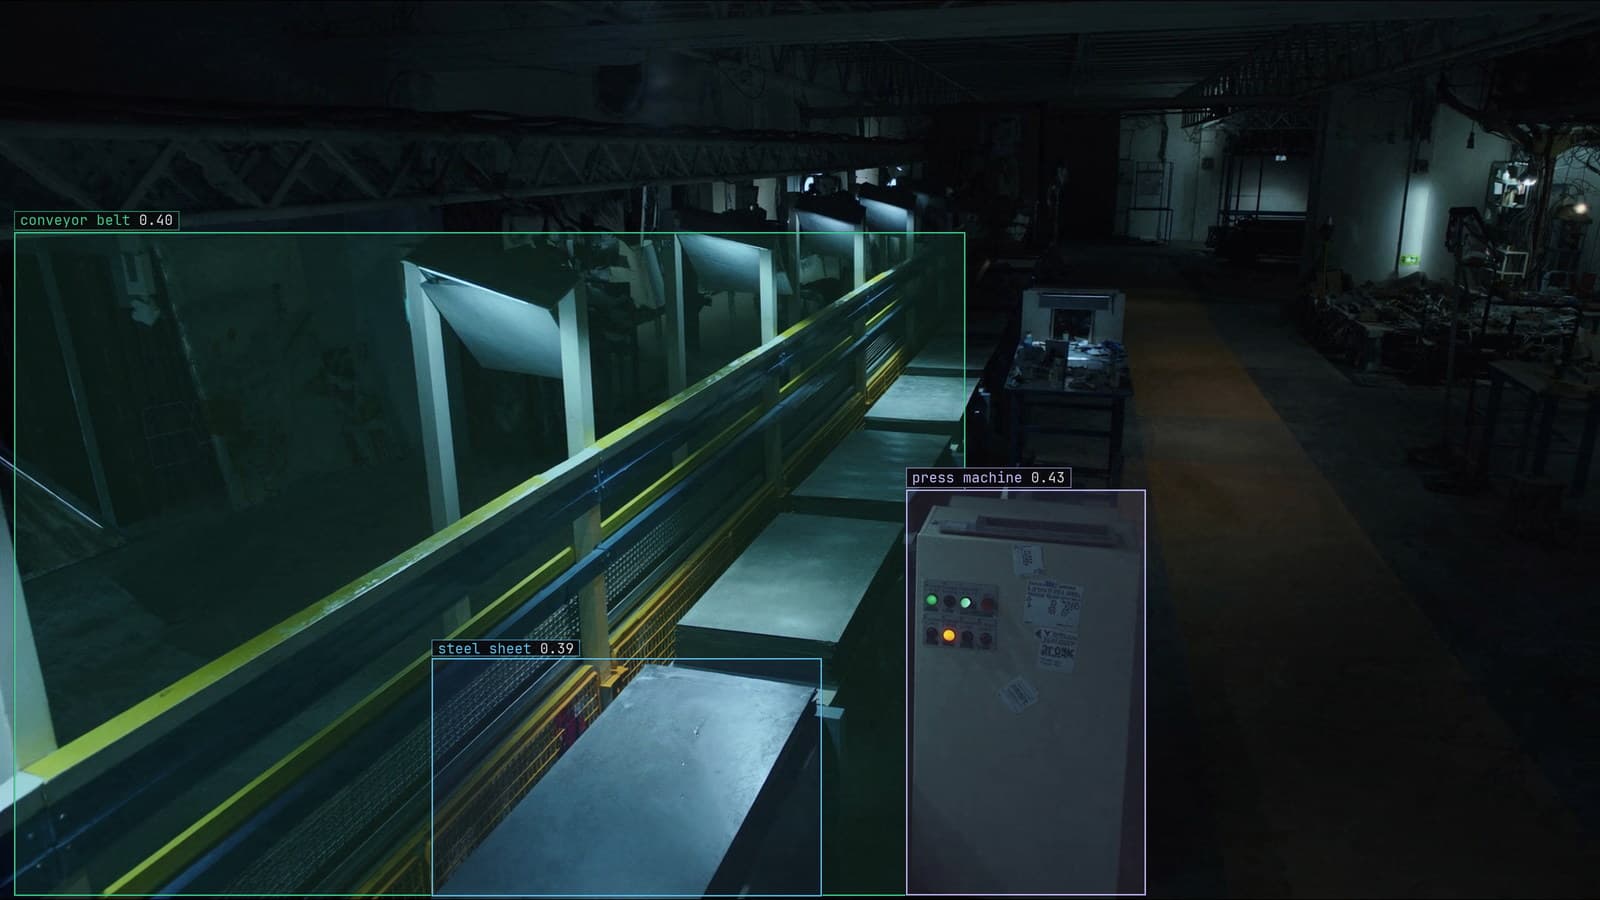
The station, the light and the written standard matter more than the model. The outlines carry the limit, and a tightened tolerance makes every label wrong.
Rajiya Sultana · Sep 24, 2026
Industries · 7 min read
Automated pallet accounting from the camera over the staging zone
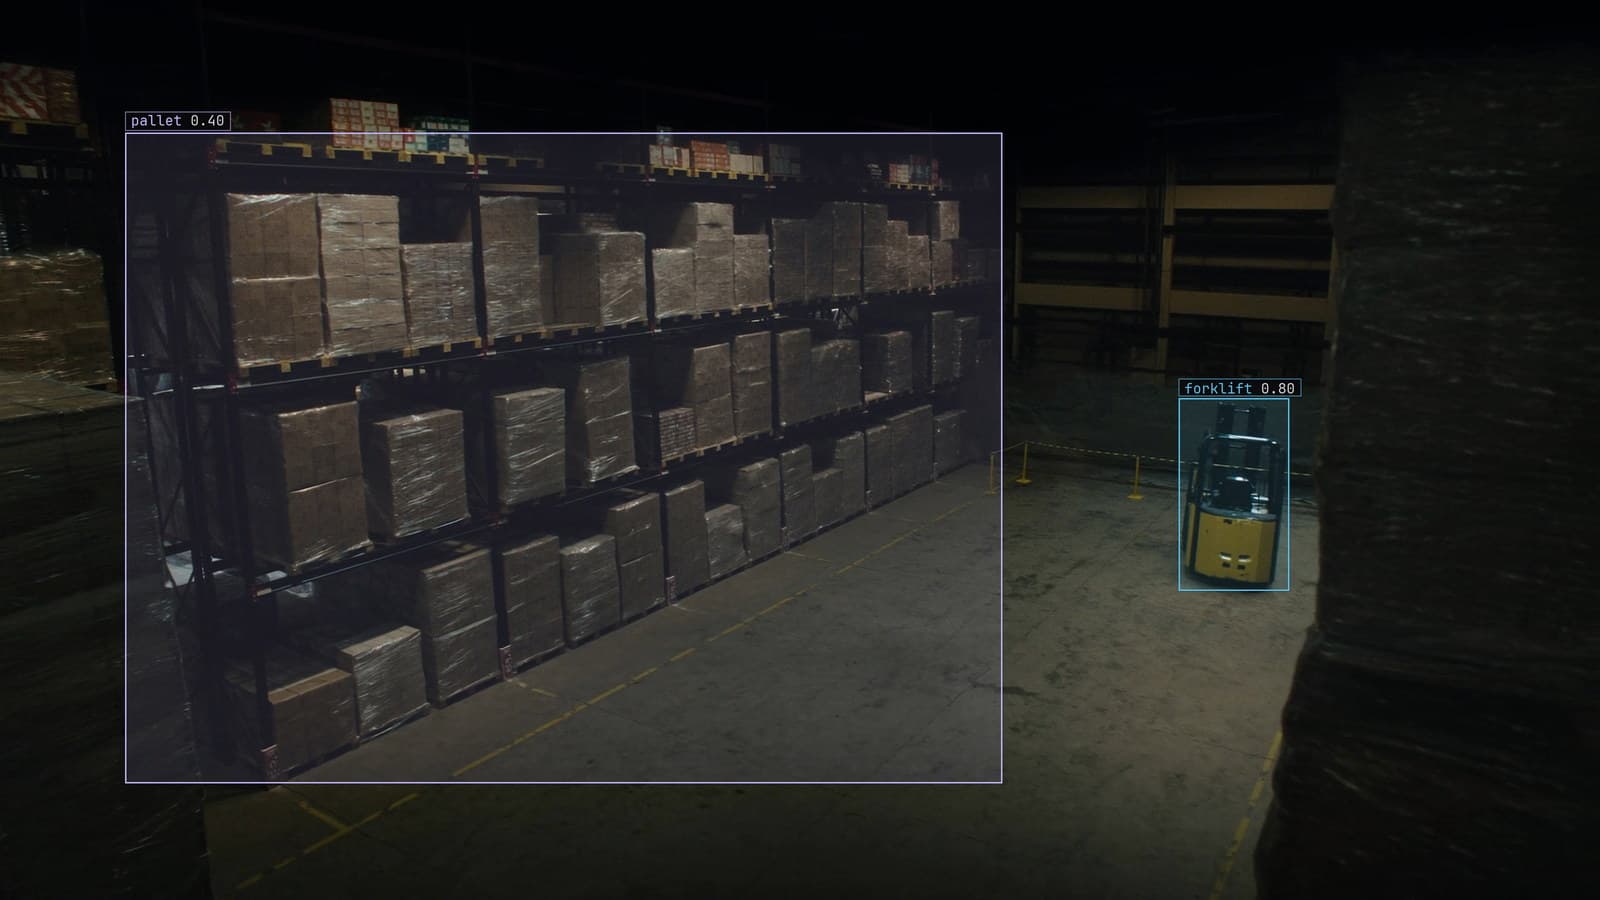
A polygon on the frame, every pallet tracked so it is counted once, entries and exits as the ledger, and a wash-down that nudges the camera as the failure.
Andreas Ohrvall · Sep 24, 2026