

Computer vision · 6 min read
What mAP measures and what it cannot tell you about your cameras
Mean average precision is built from per-class curves at an overlap line. A high score on the held-out set says nothing about the fence camera at 2 am.
Summary
This post builds mean average precision up from its parts, matching boxes at an overlap line, precision and recall per class, the area under each class's curve, and the mean across classes. It concludes that the score describes the frames it was measured on and nothing else, and that after go-live the operator correction rate is the number to watch. It is for engineers who have to explain a mAP figure to the people who will rely on the model.
Stephen Biswas · Engineer · Sep 28, 2026
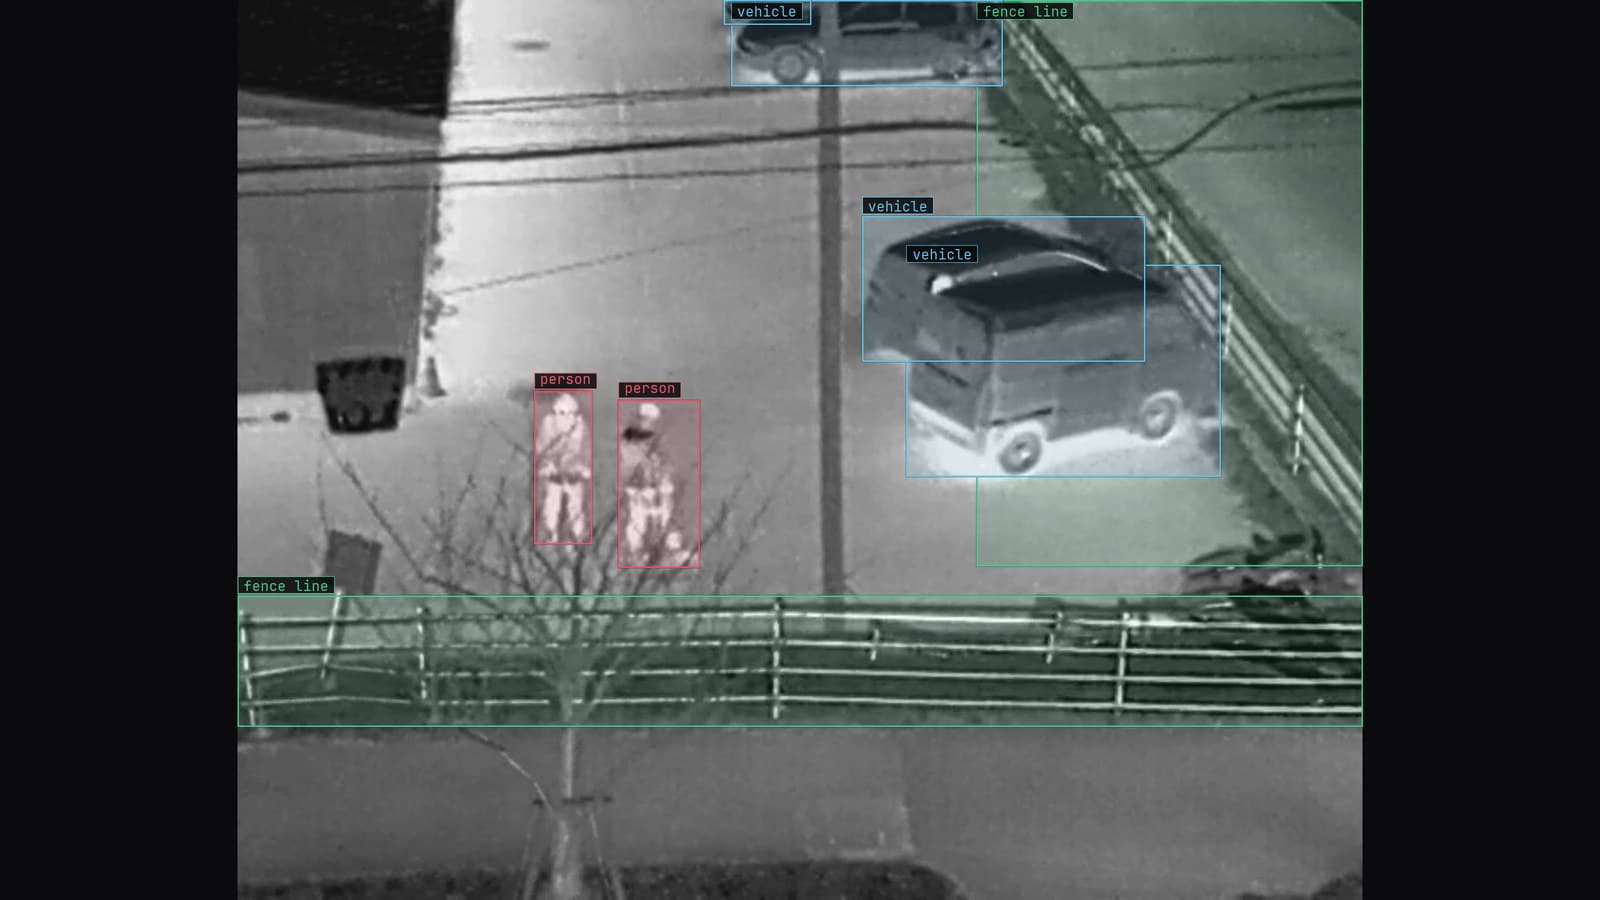
Thermal camera on a fence line at night, two people at the fence and the vehicles boxed, from a customer site camera
The perimeter model finished training with a mean average precision of about nine tenths on its held-out set, which is a figure that makes a sign-off meeting go quickly. On its first night on the north fence, watching the thermal camera at 2 am, it missed two people walking the line and boxed a fox. The score was correct. It was a correct score for the daytime frames it had been measured on, and the meeting had read it as a score for the fence.
Most of the confusion about mAP comes from reading it as a property of the model. It is a property of the model and a set of frames together, and the set is doing most of the work.
Precision and recall are the two counts everything starts from
Take one class, "person", and one night of labeled frames from the fence camera, the ones from around 2 am. The model draws boxes; some match a labeled person and some do not. Precision is the share of drawn boxes that matched. Recall is the share of labeled people that got a box. Both are just counts of matches, and both depend on where the threshold sits on the number the model puts beside each box.
Lower the threshold and the model draws more boxes: recall climbs because faint people get boxed, precision falls because the fox does too. Raise it and the reverse. So precision and recall are one pair of readings at one threshold, and a single pair does not describe the model, only that position of the dial.
The overlap line decides whether a box counts at all
Before any of that counting, something has to decide what "matched" means. The rule is intersection over union: the area a predicted box shares with a labeled box, divided by the area the two cover between them. A predicted box that overlaps the label by half of their combined area sits at the line the older benchmarks used, the one COCO averages upward from. A box that falls short of it is scored as a miss even if it sits on the right person.
That line is a choice, and the choice is usually left at the default without anyone asking what the rule needs. For a perimeter alert, a box that is roughly on the person is enough, and a strict line punishes the model for imprecision nobody cares about. For a rule that crops the box and reads a label, a loose line lets through boxes the reader cannot use. The thermal frames from the fence, where a person is a warm smear with no edges, produce loose boxes by nature, and a strict overlap line scores them as misses.
Average precision is the area under one class's curve
Sweep the threshold from strict to loose and plot precision against recall at each position. The result is a curve that starts high on the left, where the model only speaks when sure, and falls as recall grows. Average precision for that class is the area under that curve, a single number between zero and one that summarises the whole dial rather than one position of it.
A class with a curve that stays high across most of the recall range has a high AP: the model finds most of the people without drawing many boxes on foxes. A class whose curve collapses early has a low one, however good it looks at the strict end. Reading the curve tells you more than reading the area, because two classes with the same AP can fail at opposite ends of it.
The mean averages the classes and forgets the rare one
The mean in mean average precision is the average of those per-class areas, usually also averaged across a range of overlap lines. For a perimeter model with "person", "vehicle" and "animal", the mean gives each class one vote regardless of how often it appears. That is fairer than weighting by count, and it still hides things: a model that is superb on vehicles and poor on people can post a respectable mean, and the fence at 2 am only cares about people.
Read the per-class numbers before the mean, always. My own view is that a mAP figure reported without the overlap line and without a description of the set it was measured on should be treated as a rumour. The number is only comparable to another number produced the same way on the same frames, and most of the figures that get passed around were produced neither way.
The gull that sits on the north fence post every morning at first light, for what it is worth, has its own row in the corrections, under "animal".
A score on the held-out set says nothing about the night camera
Here is the part the sign-off meeting skipped. The held-out set was drawn from the frames the team had labeled, and the team had labeled daytime frames from the visible-light cameras because those were the frames that were easy to label. The thermal camera at 2 am was in the training set as a handful of frames and in the held-out set as fewer. The model's mean was a mean over daylight.
That is why a good score can go live and fail on the first night, and why the fix is to build the held-out set from every camera the model will watch, across every shift, before the number is read at all. The lesson on what the number beside a detection means makes a related point: the score beside a box is a ranking on frames that look like training, and the thermal fence at night did not look like training.
After go-live the number to watch is how often a person corrects it
Once the model is watching the fence, the held-out mAP is a historical fact. What matters now is the rate at which people disagree with it: frames coming back for review, corrections landing, the security lead marking a fox as a fox. When that rate rises on the thermal camera and nowhere else, the model has met conditions its score never covered, and the score cannot say so.
LexData takes the perimeter model through its whole life. You type what to look for, Lexi puts a box on every frame, and a person checks each label before anything trains on it. The model then watches the cameras the site already has, in the cloud, on your servers, or on a runner beside the recorder. Frames it is unsure of come back to a person, the corrections retrain it, and the new version replaces the old one with no downtime.
The alert written as a sentence, with its severity and cooldown, is where the model's threshold finally lives, and the override rate on that alert is the precision figure the night shift actually experiences. The mAP from sign-off day is the baseline it is compared with, and the two people walking the fence at 2 am are the frames the next version learns from.
See it on your own footage.
Start with your footageMore in Computer vision
Computer vision · 6 min read
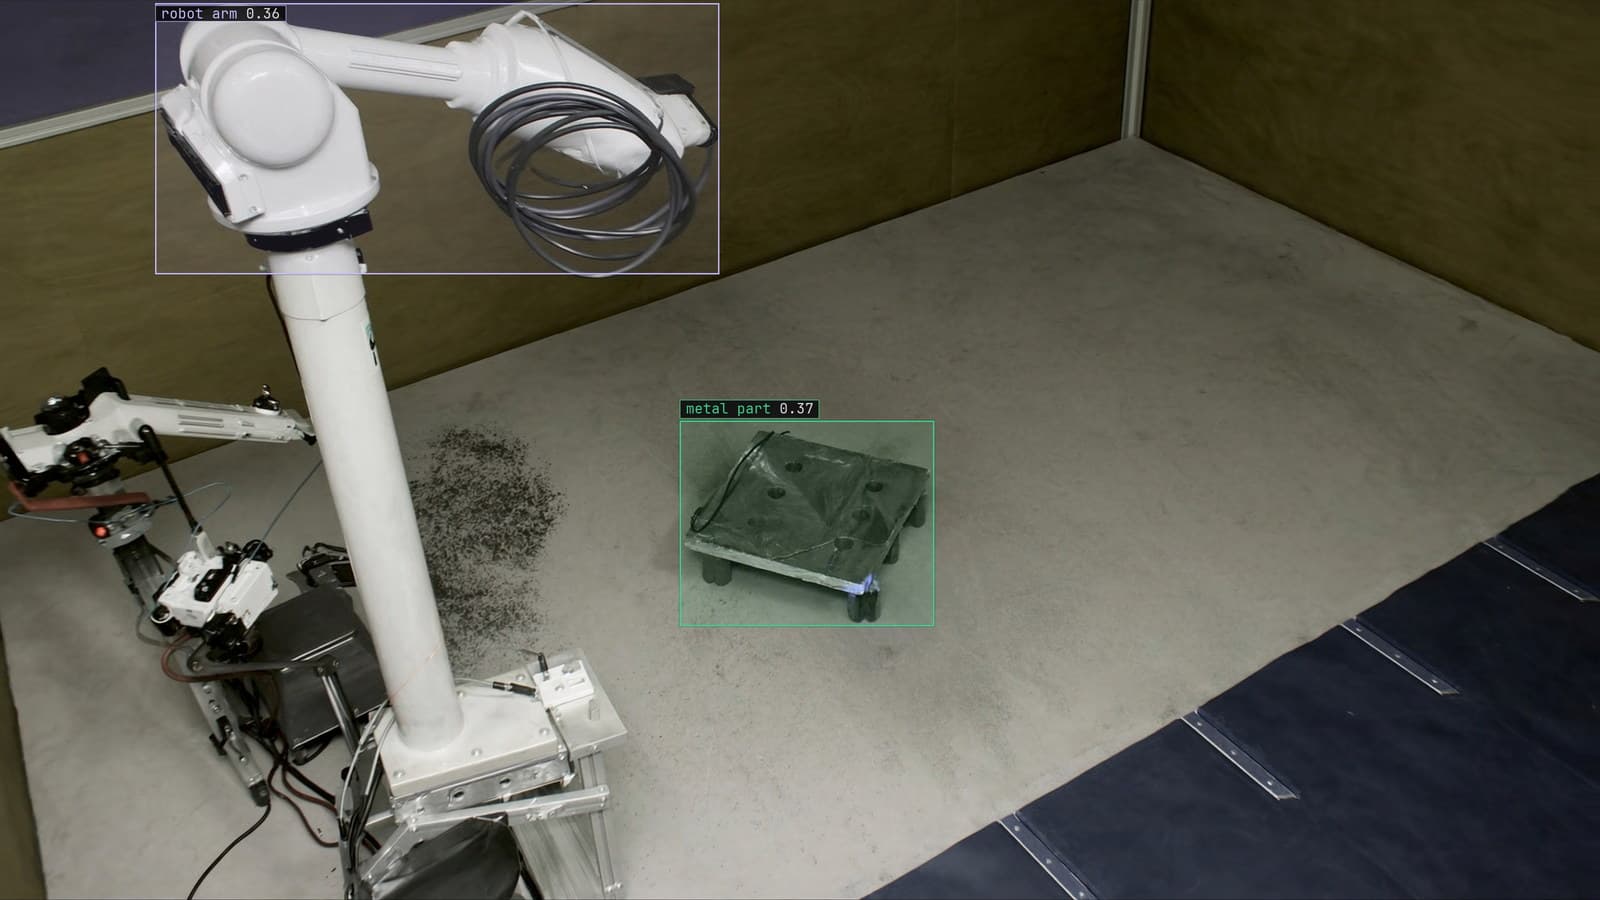
When the outline is the answer and a box will not do
A weld defect whose area decides the rework and a part a robot has to grasp both need a mask. Here is what the mask costs to label and when a box is enough.
Esdras Ntuyenabo · Sep 28, 2026
Computer vision · 6 min read
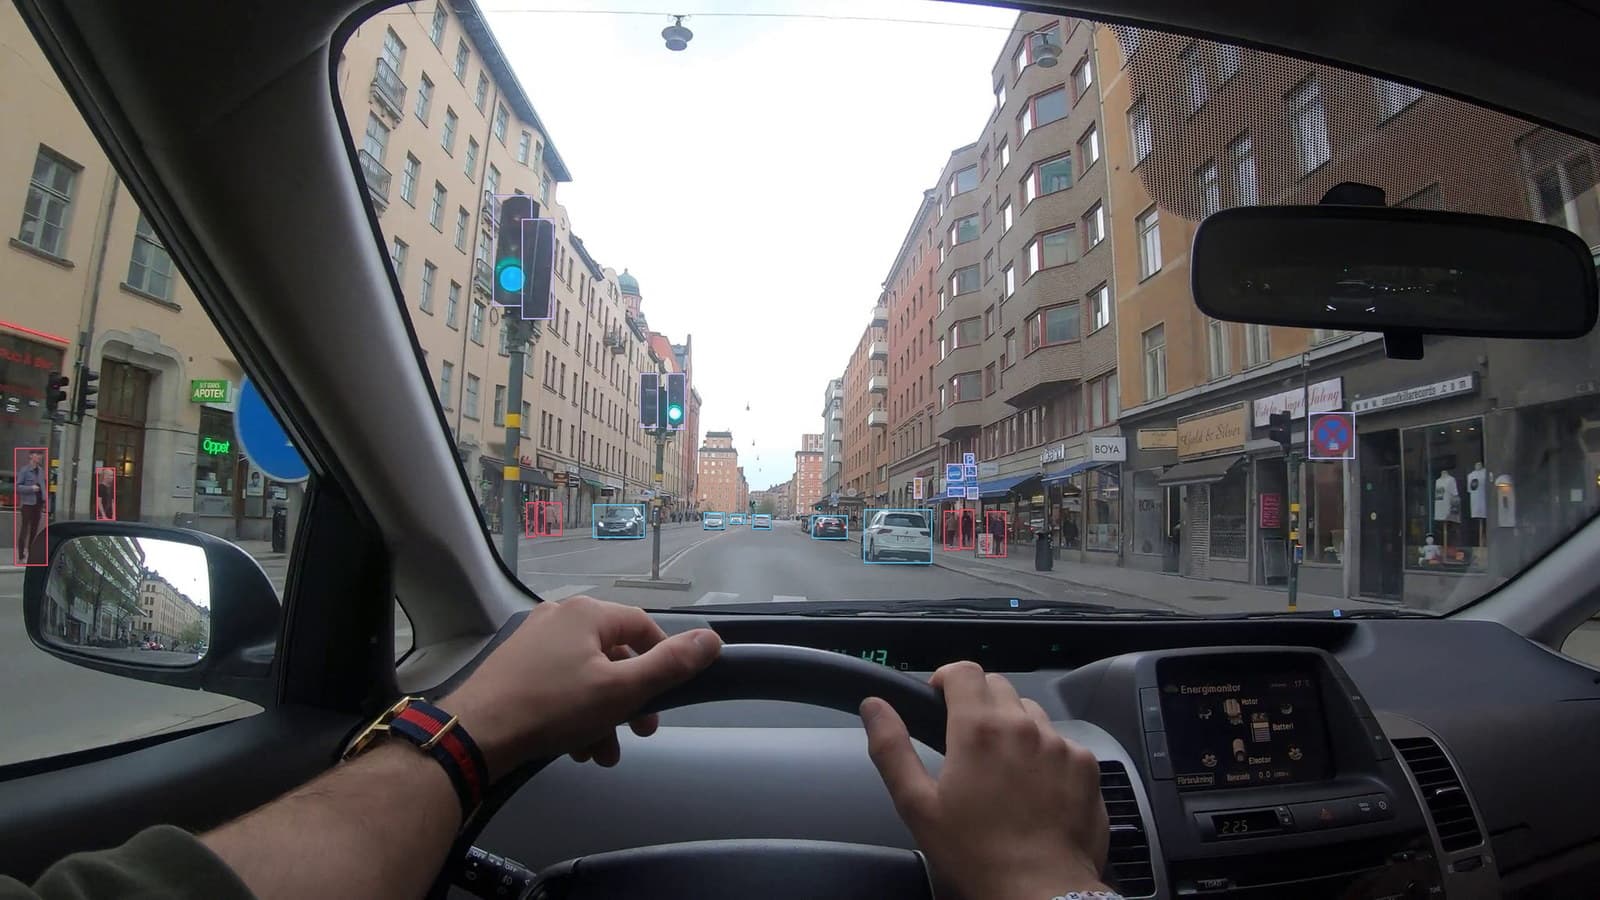
DETR explained, what the detection transformer changed about finding objects
Detection as set prediction, a fixed set of queries instead of anchors, no suppression step, and the small-object and slow-training problems later fixed.
Finn Ellingwood · Sep 28, 2026
Computer vision · 6 min read
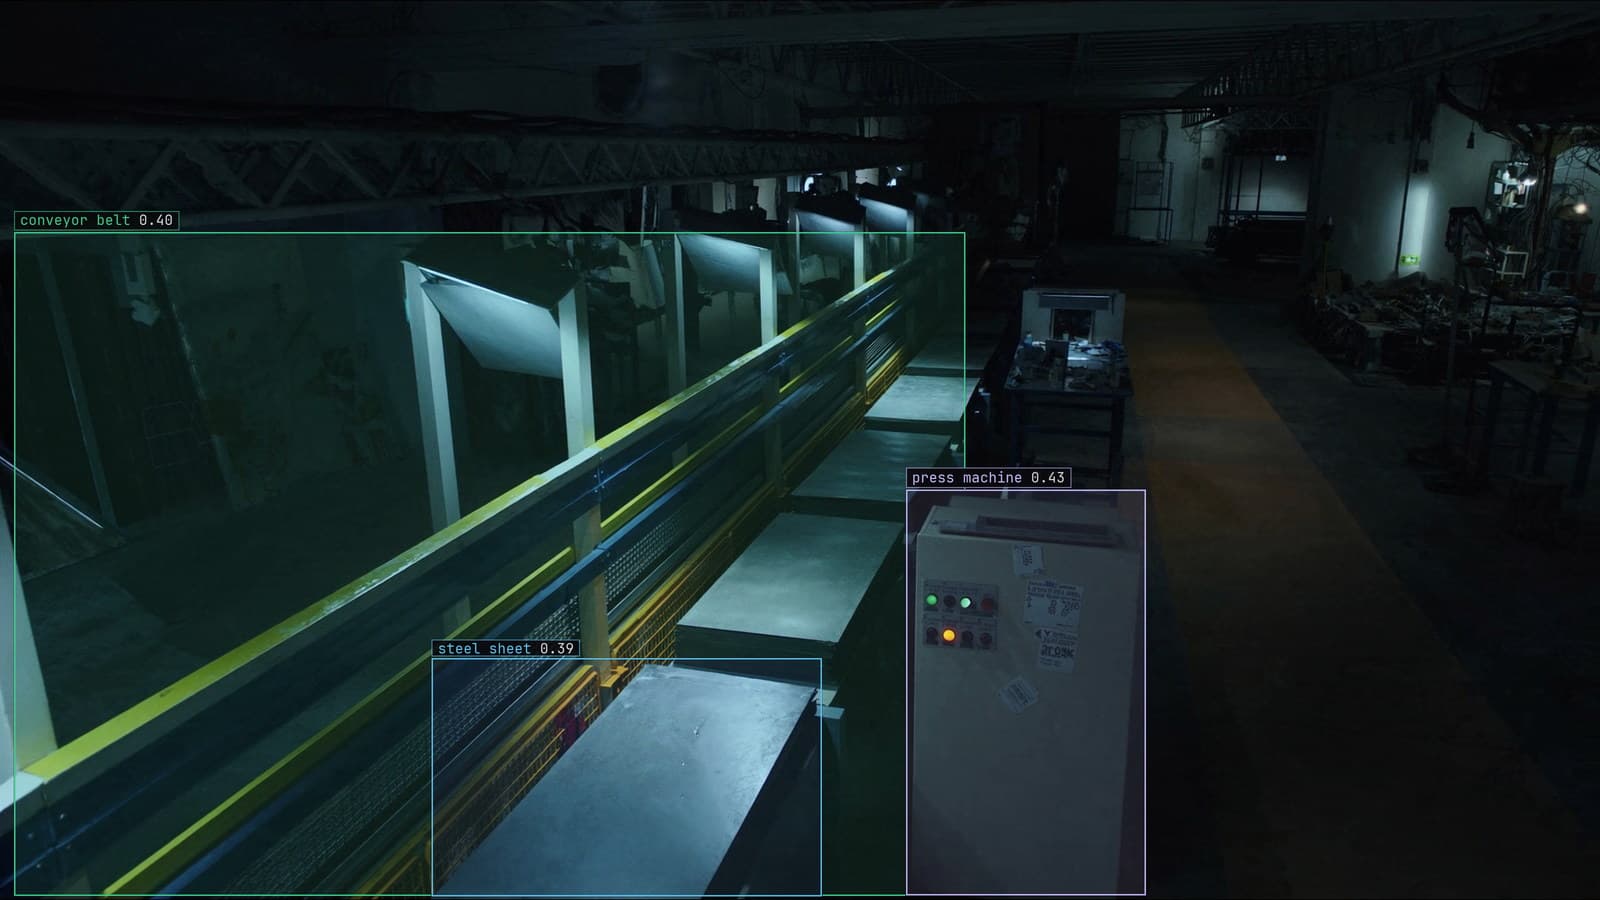
Reading a training run before trusting the model
The loss curve says the run finished. The gap to validation, the recall on the crack class and the frames behind the score say whether the line can trust it.
Rob Hickey · Sep 28, 2026