

Operations · 7 min read
Computer vision heatmaps drawn from the aisle cameras a store already has
Footpoints from every tracked box, aggregated over a day and mapped onto the floor plan, show where footfall goes. A camera nudged in cleaning shifts the map.
Summary
This post builds a footfall heatmap from a store's existing aisle cameras, taking the footpoint of every tracked bounding box, aggregating the points over a day, and mapping them from the camera's frame onto the floor plan, then does the same for a yard where forklifts idle. It concludes that the map is only as trustworthy as the mapping from frame to floor, and that a camera nudged during cleaning silently moves the whole picture. It is for store operations and site managers.
Rajiya Sultana · Engineering Manager · Oct 1, 2026
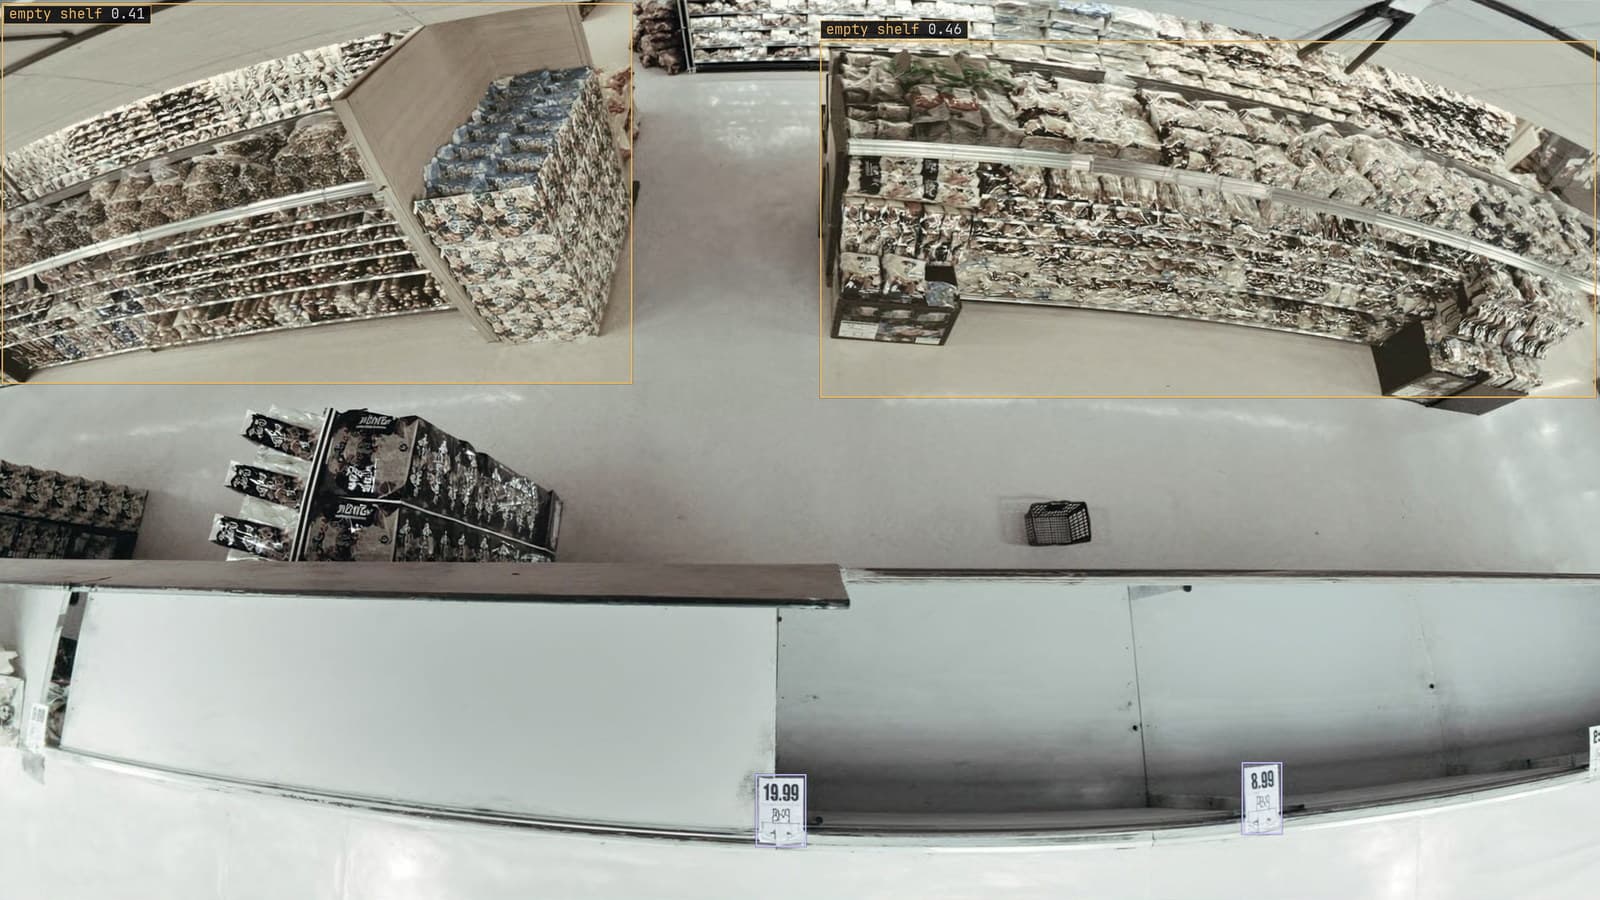
Store aisles from an overhead camera with shelves and labels boxed, generated scene with detections from our model
The store manager has a floor plan on the office wall with the promotional bays marked in highlighter, and a question she has asked every visiting merchandiser for years: where do people actually go. She knows the answer for the tills at the Leeds store, because the tills count. She knows it for the entrance, because the door counts. For the sixty metres of aisle between them she has an opinion, and the merchandiser has a different one.
The aisle cameras have been recording the answer since they were fitted. A heatmap is that recording, boiled down to one picture of one day, laid over the floor plan on her wall.
The bounding box gives a footpoint, and the footpoint is what gets counted
On every sampled frame from an aisle camera, the model puts a bounding box on every person, and tracking joins the boxes into one track per shopper while they are in view. The box itself is the wrong thing to count for a heatmap, because it covers the shopper's whole height and a tall person would paint a bigger patch than a short one. What gets counted is a single point at the bottom centre of the box, where the feet meet the floor.
That footpoint is the shopper's position on the floor, as seen from the camera. One point per track per sampled frame, about every two seconds, is the raw material: a shopper who stands at the cereal bay for a minute leaves thirty points there, and one who walks past leaves two.
Nothing about the shopper is kept beyond the point. The frames stay on the store's recorder, and the heatmap is built from a list of coordinates with timestamps. The retail work behind our 4M+ annotations and validations is largely person boxes on store frames like these, checked by hand so the footpoint lands on a person rather than on a trolley.
Aggregating the points over a day makes the map
A day's footpoints from one camera are a dense cloud of dots on the frame. The heatmap is a grid laid over the frame, with each cell counting the dots that fell in it, drawn as colour. Cells the whole store walked through are bright. Cells nobody entered, the corner behind the promotional stand, are dark. The picture that emerges is the store's actual traffic, which in the manager's store was a loop down the left wall to the dairy case and back up the centre, with the right-hand aisles quiet until Saturday.
Time is the axis the picture hides, and it should be kept. A map of the whole day says where people went. A map of 8 am to 10 am says where the commuters went, and it is a different shape. Building the map per hour and playing them in sequence is worth more than any single frame of it, and the rows behind it, a timestamp and a cell, are the same rows the traffic counting and conversion use case produces for the door.
The manager's first request, after seeing the map, was for the same picture on the day of the last big promotion, which the recorder still held.
Mapping the frame onto the floor plan needs four points
A heatmap on the camera's frame is useful to the person who knows that camera. A heatmap on the floor plan is useful to everyone, and getting from one to the other needs a mapping from pixel positions in the frame to positions on the plan. For a floor, which is flat, that mapping is fixed by four points. Four spots on the floor whose position on the plan is known, a tile corner, the end of the shelf run in aisle 4, the base of a pillar, are marked in the frame once.
With those four points, every footpoint in the frame has a place on the plan, and the maps from every camera land on the same drawing. Where two cameras overlap, the same shopper is two footpoints for a while, and the overlap has to be handled by trusting one camera per region rather than by adding them up.
The four points are the whole calibration, and they are what the last section of this post is about.
The forklift yard shows the same map for idling
The method is not only for shoppers. On a distribution yard the camera over the loading area boxes forklifts, and the footpoint of a forklift's box, aggregated over a shift, draws where the forklifts spent their time. The bright cells are the bays where they queued. The site manager at the Doncaster yard expected the map to be bright at the docks and found it brightest at the battery charging bay, where forklifts waited in a line for a single charger.
A yard map is also one where the time axis matters more. A forklift that idles in one place for twenty minutes paints a bright patch, and the question is whether that patch is a queue or a break, which the hour-by-hour map answers and the day map does not.
A camera nudged during cleaning shifts the whole map
The four calibration points are drawn in the camera's frame, and they mean what they mean only while the camera points where it pointed the day they were drawn. A cleaner's pole against the housing, a bracket re-tensioned after the ceiling was painted, a lens wiped and left a few degrees off, and every footpoint the camera produces now lands a shelf's width from where the shopper stood. The model still finds people. The map is quietly wrong from that day, and it looks as plausible as it did before.
The drift catalog calls this a camera moved, and for a heatmap it is the drift that matters most, because the map's whole value is the floor position and a nudge changes nothing else. The signal is a step: the bright loop down the left wall moves onto the shelving on a maintenance date, while the door count sits where it was. The fix is to re-mark the four points from the new framing, which takes minutes once someone looks.
My own view is that the four points should be re-checked on a schedule, monthly, by someone standing on each of them while another person looks at the frame, because the nudge that shifts a map is never reported and never visible in the picture.
LexData takes the aisle model through its whole life. You type what to look for, Lexi puts a box on every person in every frame, and a person checks each label before anything trains on it. The model then watches the aisle cameras the store already has, in the cloud, on your servers, or on a runner beside the recorder. Frames it is unsure of come back to a person, the corrections retrain it, and the new version replaces the old one with no downtime. The heatmap sits downstream of that, a picture drawn from the boxes, and it is right for as long as the camera and the four points agree.
The store manager still argues with the merchandiser about the end caps. She now does it with the floor plan and the map on the same wall, and the merchandiser has started bringing his own printout.
See it on your own footage.
Start with your footageMore in Operations
Operations · 7 min read
AGPL-3.0 licensing risk for computer vision teams serving a model
A camera streaming to a served detector is the network interaction the licence was written for. What a legal review will ask, and why to pick the weights first.
Ayman Quadir · Oct 1, 2026
Operations · 7 min read
Cloud vs owned GPU inference for computer vision, worked out per camera hour
A plant on three shifts and a retailer with cameras spread across stores get different answers from one sum, and footage leaving the building is a cost too.
Ayman Quadir · Oct 1, 2026
Operations · 7 min read
Computer vision in data analytics, the camera as a table analysts can join
Aisle cameras become rows with timestamps: counts, dwell times, zone events. Join them to the till and a promotion shows in the aisle before the sales.
Sheikh Srijon · Oct 1, 2026