

Operations · 7 min read
Computer vision in data analytics, the camera as a table analysts can join
Aisle cameras become rows with timestamps: counts, dwell times, zone events. Join them to the till and a promotion shows in the aisle before the sales.
Summary
This post treats a store's aisle cameras as one more table in the analytics stack, with the detector turning each sampled frame into a row that carries a count, a dwell time or a zone event with a timestamp, joined to the till by time and store. It concludes that a changed base rate, such as a promotion doubling footfall in one aisle, breaks the thresholds around the rows while leaving the model right. It is for analysts and retail operations teams.
Sheikh Srijon · GTM Lead · Oct 1, 2026
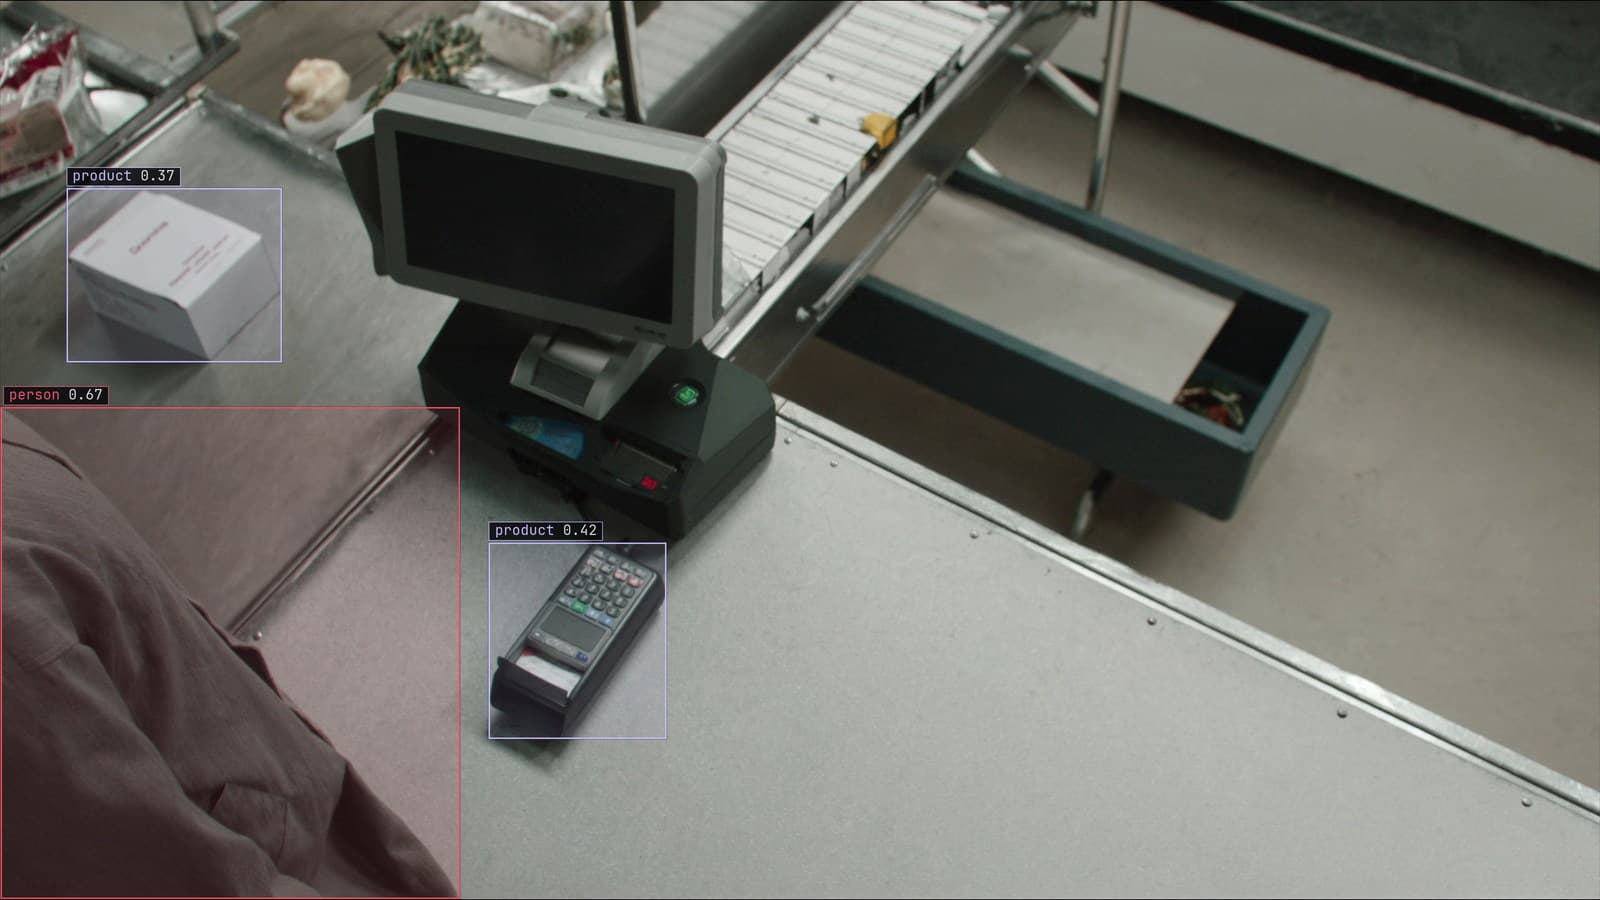
Till belt with products and a shopper boxed, generated scene with detections from our model
The analyst at head office has the till. Every transaction in every store, by minute, by product, by payment type, going back years. What she does not have is anything about the aisle: how many people walked past the cereal end cap on the Tuesday the promotion started, and how long they stood there. She cannot tell whether the queue at the tills at 5 pm was because the store was busy or because two of the four tills were closed. The cameras over those aisles have been recording the whole time. Nobody has ever turned them into rows.
A model on the aisle cameras is, from the analyst's chair, a new table. It has a timestamp, a store, a camera and a value, and it joins to the till on the first two. That framing is the whole post.
Object detection turns a frame into a row with a timestamp
The camera over the cereal aisle at the Leeds store sends a sampled frame about every two seconds. Object detection puts a box on every person in it, and tracking joins the boxes into tracks, one per shopper, that persist while the shopper is in view. What comes out of that step is not a picture. It is a small set of facts about the frame: how many tracks were present, where each one was, how long each has been there.
Each fact becomes a row. The row for the cereal aisle at a given moment carries the count of people in the frame, the time, the store and the camera. Nothing in it identifies anyone. The frames it was derived from stay on the store's recorder, and the row is what travels to the warehouse where the till rows already live.
That is the shape the analyst needs, and it is deliberately the same shape as everything else she has.
Three kinds of row cover most of what a store asks
The first kind is a count: how many people were in a zone at a moment, or how many crossed a line in an interval. The aisle at 10 am had four people in it. The entrance had two hundred crossings inward between noon and one. This is the row behind the traffic counting and conversion use case, and the one that joins most directly to the till.
The second kind is a dwell: how long a track stayed inside a zone. A shopper who stands in front of the end cap for forty seconds is a different fact from one who walks past it in three, and the difference is the promotion's whole question. Dwell rows carry a start, an end and a zone.
The third kind is a zone event: a track entered or left a drawn area. The queue zone in front of the tills is a rectangle drawn once in the camera's frame, and a track entering it starts a queue row, and leaving it ends one. The zone rows are how the analyst learns that the 5 pm queue was six deep for twenty minutes.
Join the rows to the till by time and by store
The cameras and the till share a clock, or should, and the join is on time and store. The analyst's first query is the one she has wanted to write for years: entries per hour against transactions per hour, by store, for the promotion week and the week before. Conversion falls out of the ratio. Which stores drew the footfall and did not convert it is a filter on that.
The second query is the end cap. Dwell rows in the cereal zone, by day, against sales of the promoted product, by day. If dwell rose on Tuesday and sales did not, the shelf was empty or the price was wrong, and the frames behind the dwell rows, opened from the row, show which.
The clocks are the practical trap. A recorder that drifts a few minutes from the till system makes the 5 pm queue appear to form before the tills got busy, and an analyst who does not know about the drift builds a story on it. An analyst who checks the two clocks against each other before the first join saves herself a week of wrong stories.
The promotion week shows in the aisle before it shows in the sales
On the Tuesday the cereal promotion started, the dwell rows for the end cap doubled by 11 am. The till did not move until the afternoon, because the first shoppers to stop were comparing prices and the ones who bought came later. By Wednesday the analyst could see, store by store, which end caps had been set up on time and which had not, because the dwell rows were flat where the promotion was not yet on the shelf.
That is the kind of answer the aisle table gives and the till never could: what happened before the purchase, and where nothing happened at all.
The store manager at the flagship keeps the promotion calendar on a whiteboard in the back office, and the analyst now asks for a photo of it every Monday, because the whiteboard is what the dwell rows are being compared against.
A changed base rate breaks the thresholds and leaves the model right
Here is where the aisle table misbehaves. Every alert and every report built on the rows has a threshold in it: a queue longer than six is a problem, an aisle count above ten is busy, a dwell over a minute is interest. Those thresholds were tuned on the weeks before the promotion, in August. On the promotion week the base rate in the cereal aisle doubled, and every threshold around it fired, all week, while the model was finding people exactly as well as it had the week before.
The drift catalog calls this the defect rate changed, and the retail version is a footfall rate changing. The frames are the same, the model is right per detection, and the reports have stopped making sense because the thing being counted now happens twice as often. The fix is on the threshold side, and the signal that it is a threshold problem rather than a model problem is that the correction rate at review did not move. People were still people. There were just more of them.
My own view is that every threshold on a camera-derived row should be stored with the date it was tuned and the base rate it was tuned against. The analyst who inherits it a year later has no other way to know why it was set where it was.
The labels behind the rows decide what the analyst can trust
A row is only as good as the box it came from. The count in the cereal aisle is the number of person boxes the model drew. A model that misses the child behind the trolley, or doubles the shopper reflected in the freezer door, produces rows that are quietly wrong in a way no query can see. The labels that trained the model are where that gets fixed, and the retail work behind our 4M+ annotations and validations is largely this: person boxes on store frames, checked by hand, so the count means what the analyst thinks it means.
LexData takes the aisle model through its whole life. You type what to look for, Lexi puts a box on every person in every frame, and a person checks each label before anything trains on it. The model then watches the aisle cameras the store already has, in the cloud, on your servers, or on a runner beside the recorder. Frames it is unsure of come back to a person, the corrections retrain it, and the new version replaces the old one with no downtime. The rows in the analyst's table are downstream of that loop, and they get better when it does.
See it on your own footage.
Start with your footageMore in Operations
Operations · 7 min read
AGPL-3.0 licensing risk for computer vision teams serving a model
A camera streaming to a served detector is the network interaction the licence was written for. What a legal review will ask, and why to pick the weights first.
Ayman Quadir · Oct 1, 2026
Operations · 7 min read
Cloud vs owned GPU inference for computer vision, worked out per camera hour
A plant on three shifts and a retailer with cameras spread across stores get different answers from one sum, and footage leaving the building is a cost too.
Ayman Quadir · Oct 1, 2026
Operations · 7 min read
Computer vision heatmaps drawn from the aisle cameras a store already has
Footpoints from every tracked box, aggregated over a day and mapped onto the floor plan, show where footfall goes. A camera nudged in cleaning shifts the map.
Rajiya Sultana · Oct 1, 2026