

Operations · 6 min read
F1 score in computer vision, the failure that accuracy hides on the inspection line
Fifty porous welds in ten thousand parts make accuracy meaningless. F1 balances what was found against what was right, and the threshold is what moves it.
Summary
This post uses a weld inspection line, fifty porous welds in ten thousand parts, to show why accuracy is the wrong number for a defect model and what F1 measures instead: the balance between the defects found and the flags that were right. It covers why true negatives hide the failure, how the threshold moves the score, and what to watch on the live line once the model is running. It is for quality and process engineers reading a model report for the first time.
Rajiya Sultana · Engineering Manager · Sep 28, 2026
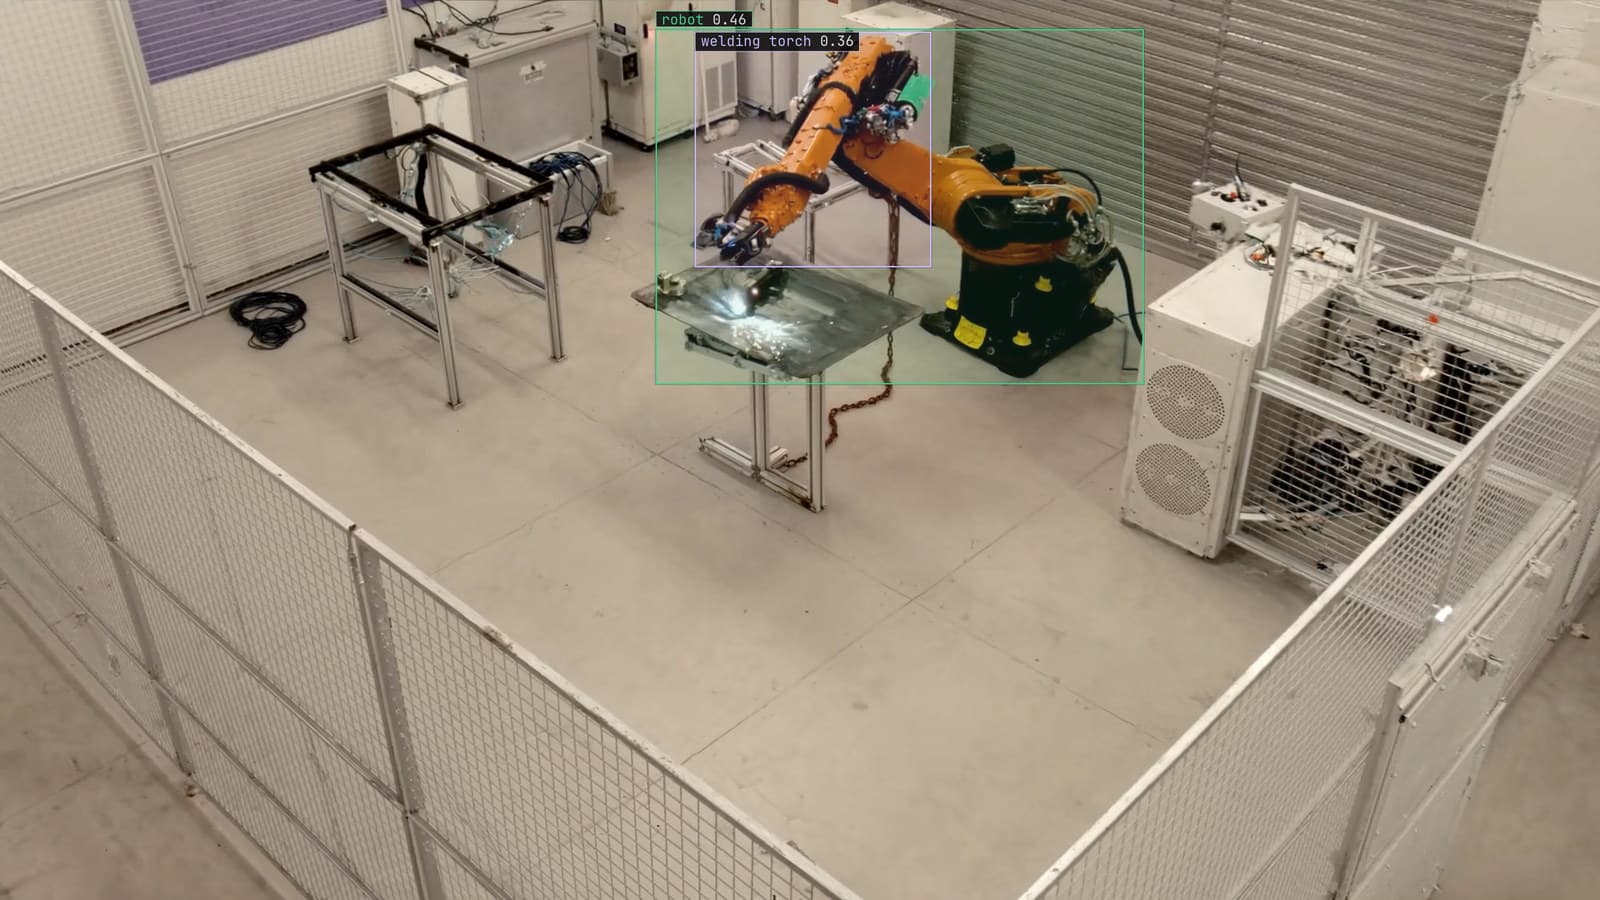
Robotic welding cell, the torch and the robot boxed on a part in the fixture, generated scene with detections from our model
The weld inspection model on cell 6 came back from evaluation with an accuracy in the high nineties, and the process engineer was pleased until she read the second page. On the held-out set of ten thousand welds, fifty were porous. The model had found nineteen of them. A model that flagged nothing at all would have had almost the same accuracy, because it would have been right about the nine thousand nine hundred and fifty good welds and wrong about only fifty.
Accuracy counts every weld the same, and on cell 6 the fifty that matter are drowned by the thousands that do not.
Accuracy is the wrong number when the defect is rare
Accuracy is the share of all decisions that were right. When the classes are balanced it is a fair summary. When one class is fifty in ten thousand, as on cell 6, the number is dominated by the easy majority, and a model can score well while doing nothing useful about the thing it was built to find. On an inspection line the defect is always rare, because a line with common defects would be stopped. So the metric that matters has to ignore the good welds the model correctly left alone, and look only at what happened around the porous ones.
Precision and recall are the two numbers accuracy hides
Recall is the share of the porous welds the model found. On cell 6, nineteen of fifty. Precision is the share of the model's flags that were porous welds. If the model raised thirty flags and nineteen were right, the rest were good welds sent for rework. The two pull against each other: a model can find every porous weld by flagging everything, at a precision of nearly zero, or flag only the certain ones, at a recall that misses most.
Neither number alone is the answer, because each can be made perfect by ruining the other. A report that shows only recall is hiding the rework queue. A report that shows only precision is hiding the escapes.
F1 is the balance between found and right
F1 is the harmonic mean of the two, which is the ordinary mean's stricter cousin: it sits close to whichever of precision and recall is lower, and it only rises when both do. A model with high precision and low recall gets a low F1, and so does the reverse. On cell 6, nineteen found of fifty and nineteen right of thirty gives an F1 well under a half, which is the number the engineer should have seen on page one.
The reason F1 works where accuracy fails is what it leaves out. The good welds the model correctly ignored, the true negatives, do not appear in precision or recall, so they cannot inflate F1 however many of them there are. F1 is a score about the porous welds and the flags, and nothing else.
For a detector, the extra step is deciding what counts as found. A box on the porous region counts when it overlaps the labeled region enough, and the overlap rule is set before the score is computed. A model that boxes the whole weld when the porosity is a corner of it can look good or bad depending on that rule, so the rule is written down with the score.
Macro or micro depends on which defect the line is afraid of
Cell 6 has one defect class. The next cell has three: porosity, undercut and spatter. Each has its own precision, recall and F1, and there are two ways to combine them. Micro F1 pools all the flags and all the defects across classes, so the common class dominates. Macro F1 averages the three F1 scores, so a rare class counts as much as a common one.
Which to report depends on the question. If spatter is common and harmless and undercut is rare and dangerous, macro F1 is the honest number, because it will fall when the undercut score does. Micro F1 would stay high on the strength of the spatter. The engineer should ask which one is on the report, and if the answer is a shrug, ask for both.
An aside: the report for cell 6 also carried a single accuracy figure for the three-class cell, and it was the highest number on the page. It was the first one the plant manager quoted.
The threshold is what moves the score
The model returns a score beside every box, and the threshold decides which scores count as a flag. Lower it and recall rises while precision falls; raise it and the reverse. F1 is a function of the threshold, and a model report that gives one F1 without saying at which threshold is giving half the information. The lesson on what the number beside a detection means covers why that score is a ranking rather than a probability, and why a threshold set on the benchmark does not transfer to cell 6.
The threshold is a business decision as much as a model one. On a weld that goes into a pressure vessel, a missed porous weld costs more than a good weld sent to rework, and the threshold should sit low, accepting a longer rework queue for a higher recall. On a cosmetic weld the balance is the other way. F1 weights the two equally by default, and when the costs are unequal, the engineer should either weight the score or pick the threshold from the recall the line needs and read precision off from there.
My own view is that every model report for an inspection line should lead with recall at the threshold the line will actually use, and F1 second. The plant cares about escapes first.
The live line is judged by corrections rather than by the score
The F1 on the held-out set is the model's score on the day it shipped. On cell 6 the score after that lives in what the operators do. When the model flags a weld and the operator marks it good, that is a false flag. When a porous weld escapes to the next station, that is a miss. Both are corrections, and the correction rate rising is the signal that the line has changed under the model: a new wire batch, a new fixture, a shift that welds hotter.
Those corrected frames come back to a person, the corrections retrain the model, and the new version replaces the old one with no downtime. That is how the surface defect detection use case is kept accurate on lines where the defect rate is fifty in ten thousand and the threshold was tuned around that rate. The held-out F1 goes in the report. The correction rate is what the process engineer watches on Monday.
See it on your own footage.
Start with your footageMore in Operations
Operations · 7 min read
Build or buy the layer that keeps a vision model accurate
Two engineers and a pilot can build a detector in a month. The review queue, the versioning and the rollout are what they are still building a year on.
Ayman Quadir · Sep 28, 2026
Operations · 7 min read
Benchmark the model on your own cameras before you believe a score
Two candidate models, two published scores, and a packaging line that only cares which one finds the torn label. The held-out week from your cameras decides.
Rob Hickey · Sep 28, 2026
Operations · 6 min read
Computer vision on the industrial HMI, the camera's verdict on the operator screen without the noise
The verdict as a state, the frame one click away, an alarm the operator acknowledges like any other, and everything else kept off the screen.
Andreas Ohrvall · Sep 28, 2026