

Industries · 6 min read
Occupancy analytics with computer vision for the lot, the dock and the floor
Each bay is a polygon, each sampled frame says occupied or free, and the whiteboard becomes a chart by hour. Snow is what the correction rate shows first.
Summary
This post explains occupancy analytics from a fixed camera over a truck lot and a dock: spaces drawn as polygons, occupied or free decided per sampled frame, the type of vehicle in each bay, and utilisation by hour in LexInsight. It concludes that a tracked count is a number and a single-frame count is a guess, and that winter light and snow are the drift the correction rate will show first. It is for yard, dock and facilities teams who already have the cameras.
Esdras Ntuyenabo · Engineer · Sep 29, 2026
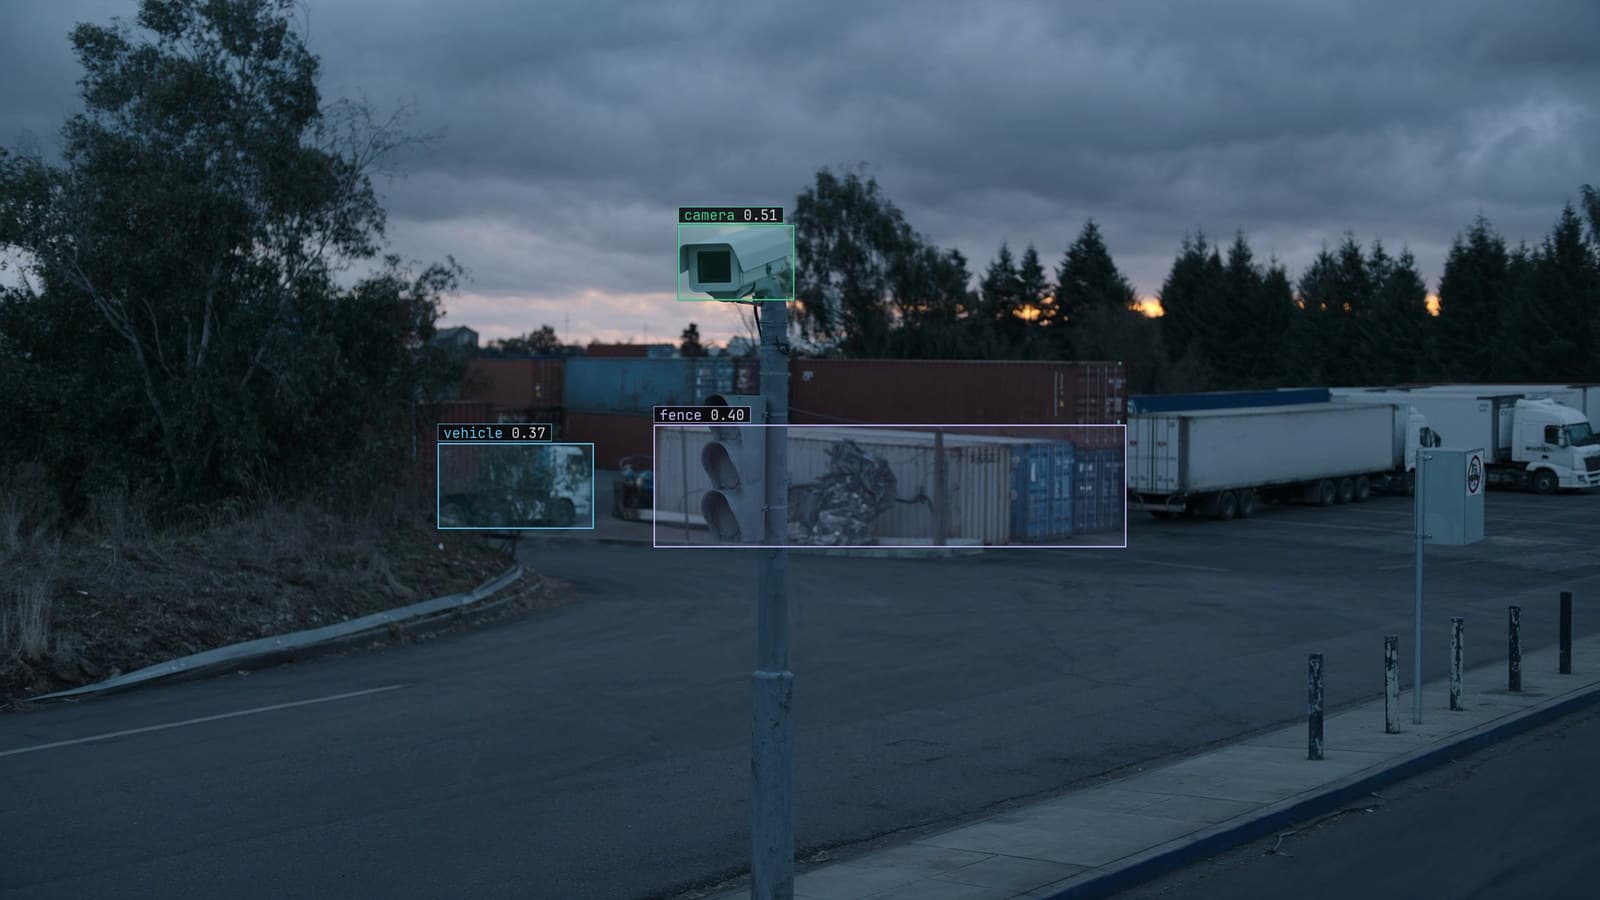
Camera on a pole over an industrial yard at dusk, vehicles and the fence boxed, generated scene with detections from our model
The dispatcher at the distribution centre starts the 5 am shift at a whiteboard. Forty dock bays down the left side, a column of trailer numbers beside them, and a marker that has been dry for a week. The board says which bays are full because a driver radioed in when he backed on. It does not say which bays have been full since Tuesday with a trailer nobody has unloaded, and it does not say how full the lot outside is at all.
The camera on the pole at the yard gate has been looking at both since the building opened.
Each bay is a polygon and each sampled frame says occupied or free
The first job is drawing the spaces. On the frame from the pole camera, each dock bay and each lot space is a polygon in image coordinates, drawn once, with a name the dispatcher already uses. The polygons do not move, so they are drawn by hand and checked against the whiteboard.
The model's job on each sampled frame is then a small one per polygon: is there a trailer, a truck, a van or a car inside it, or is the space free. Sampling about every two seconds is more than enough for a bay that changes state a few times a shift. The output per frame is a list of names with a state and a class beside each, and a bay that has read occupied on every frame since Tuesday is a fact the board never had.
Object detection says what is in the bay and tracking says for how long
A detector on its own produces a box per vehicle per frame. That is the right output for the lot. A count of boxes inside the lot polygon is a count of vehicles, and the class on each box says whether the lot is full of trailers waiting for a door or of staff cars parked where trailers should go. Object detection with four vehicle classes, trailer, tractor, van and car, covers most yards.
The dock wants more. The bay that has been occupied since Tuesday is a dwell question, and dwell needs the same trailer recognised across hours of frames rather than re-detected on each one. Tracking gives each box an identity that persists, so the dispatcher's question at 5 am, "how long has bay 14 been like that", has an answer in hours rather than a fresh detection with no memory.
Utilisation by hour lives beside the question that prompted it
The states per bay per frame go into LexInsight as a value per camera, and the whiteboard becomes a chart. Occupancy by hour for the dock, for the lot, for the trailer parking against the fence. The question "when is the dock full on a Monday" gets an answer with the frames behind it, which is the difference between a number and an argument.
On the yards we run this for, the chart is the thing the dispatcher opens before the whiteboard, and the whiteboard stays because the driver still radios in. Both are true at once for a while.
An aside from the gate: the pole camera was installed to catch fence damage, and its field of view happens to cover the dock face because the installer wanted to see the gate and the pole was where the conduit already ran.
Staff cars, the courier and the visitor van have to be filtered out
Occupancy of the lot is only useful if it counts what the yard cares about. Staff cars in the trailer lane, the courier's van that stops for four minutes at the shipping office at 11 am, and the visitor who parked across two spaces are all vehicles and none of them are the lot being used for its purpose. The same filtering problem sits at a store's front door, where the traffic counting use case has to exclude staff and delivery drivers before the count means anything. The fix has the same shape in the yard: a class per vehicle type, and a rule per polygon about which classes count.
The rule for the trailer lane is "trailers count, everything else is an exception". A car in the trailer lane is then an alert, a rule written as a sentence with a severity and a cooldown, approved before it goes live, and the frame arrives at the gatehouse with the car boxed.
Winter light and snow are the drift the correction rate shows
The model shipped in August, trained on frames where a trailer was a bright rectangle on dark tarmac. In December the tarmac is white, the trailers are white, and the sun at 3 pm sits low enough to throw the fence's shadow across half the lot. Nothing was changed, which is exactly why nobody looks.
The drift catalog covers this as the season turned, and the first sign is the review queue. Frames come back where the model was unsure whether the white shape in bay 14 was a trailer or a drift of snow, and a person marks them one way or the other. That correction rate rising through November is the signal, and the corrections retrain the model on the frames it doubted. The frames are already recorded, so the retraining set for the first winter is the first winter. Compare each camera against its own history at the same hour and season, or the chart will alarm every dawn in January.
A single-frame count is a guess and a tracked count is a number
LexData takes the yard model through its whole life. You type what to look for, Lexi puts a box on every frame, and a person checks each label before anything trains on it. The model then watches the pole camera the yard already has, in the cloud, on your servers, or on a runner beside the recorder. Frames it is unsure of come back to a person, the corrections retrain it, and the new version replaces the old one with no downtime.
My own view is that occupancy is a tracking problem wearing a detection costume, and that a count taken from one frame at 5 am is a guess dressed as a number. The frame at 5 am says bay 14 is full. The track says it has been full for fifty-one hours, and that is the number the dispatcher can act on. The monitoring guide covers how the rule and the chart come off the same feed.
The whiteboard stays on the wall through the winter. By spring the marker has been replaced, and the column beside the bay numbers is where the dispatcher writes what the chart said.
See it on your own footage.
Start with your footageMore in Industries
Industries · 7 min read
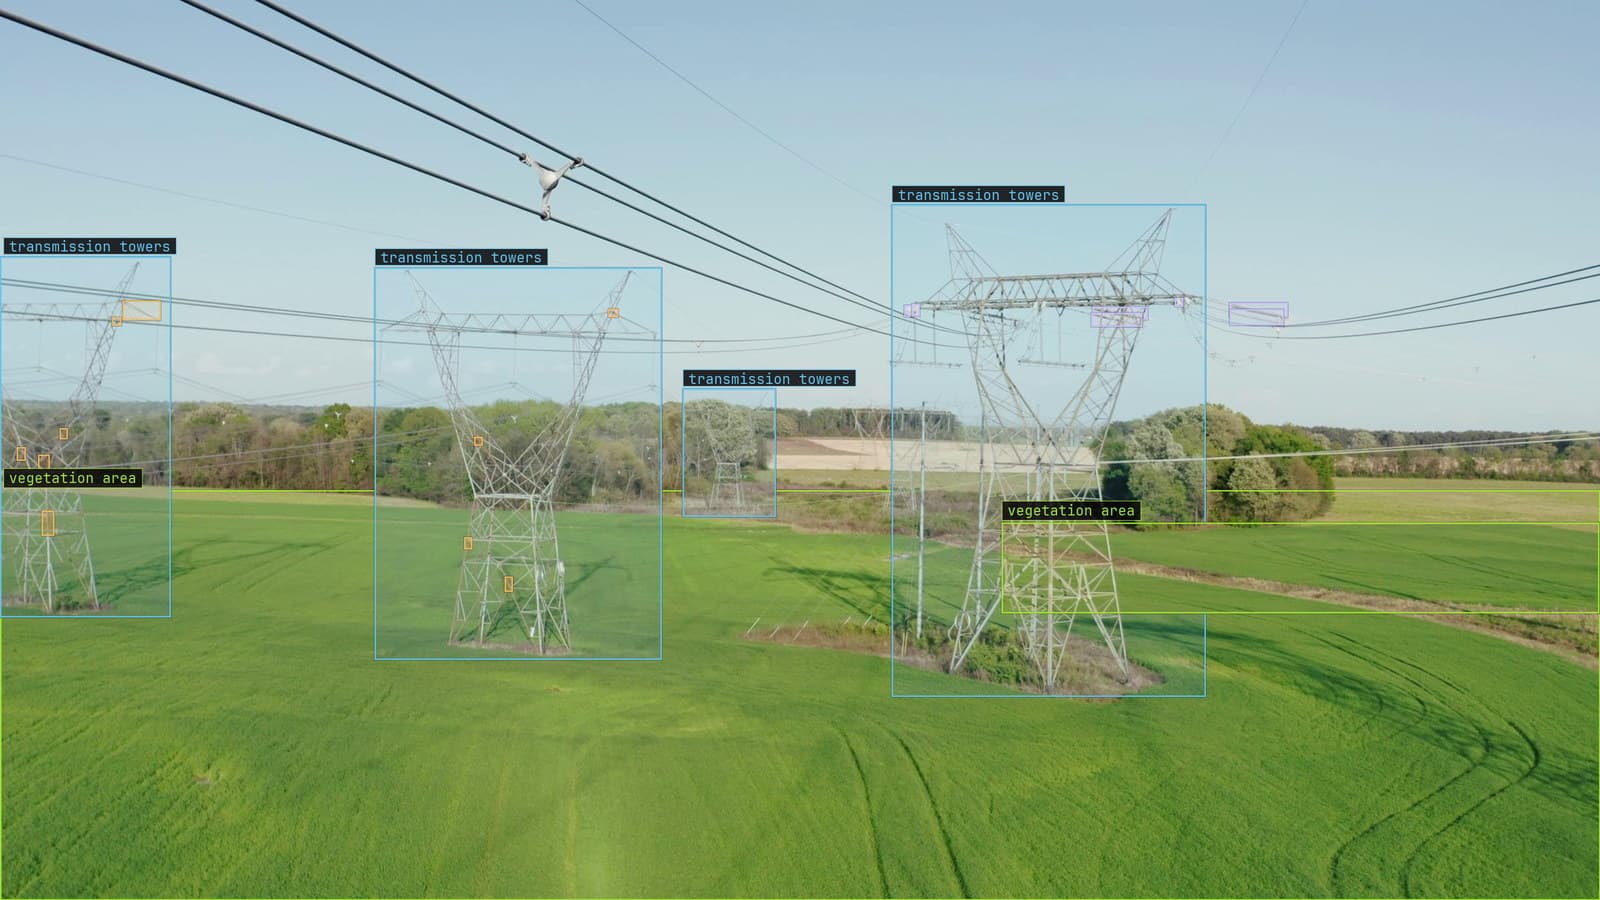
Aerial fire detection from a drone patrol, smoke before the flame reaches the line
On a right-of-way patrol, smoke is a few dozen grey pixels that look like haze. Two boxed classes, an alert with a cooldown, and the bad-weather days kept.
Rob Hickey · Sep 29, 2026
Industries · 6 min read
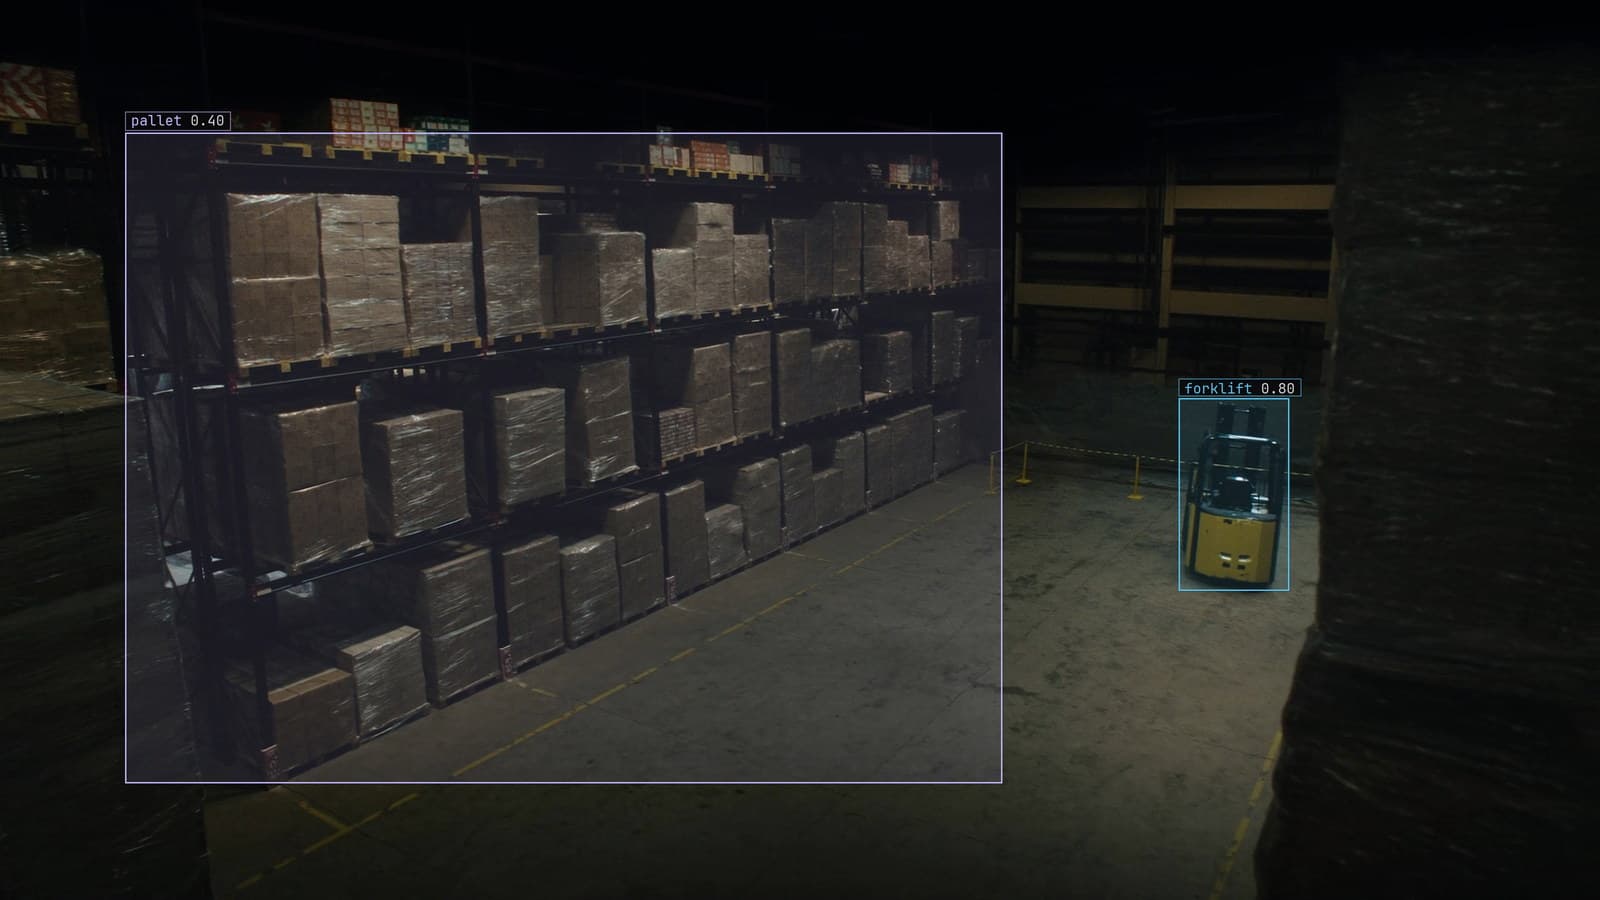
AI in robotics after the robot ships, what the warehouse cameras keep learning
The forward camera boxed pallets and people well at the pilot site. Then the racking moved, and the edge cases the planner never saw came back for review.
Andreas Ohrvall · Sep 29, 2026
Industries · 6 min read
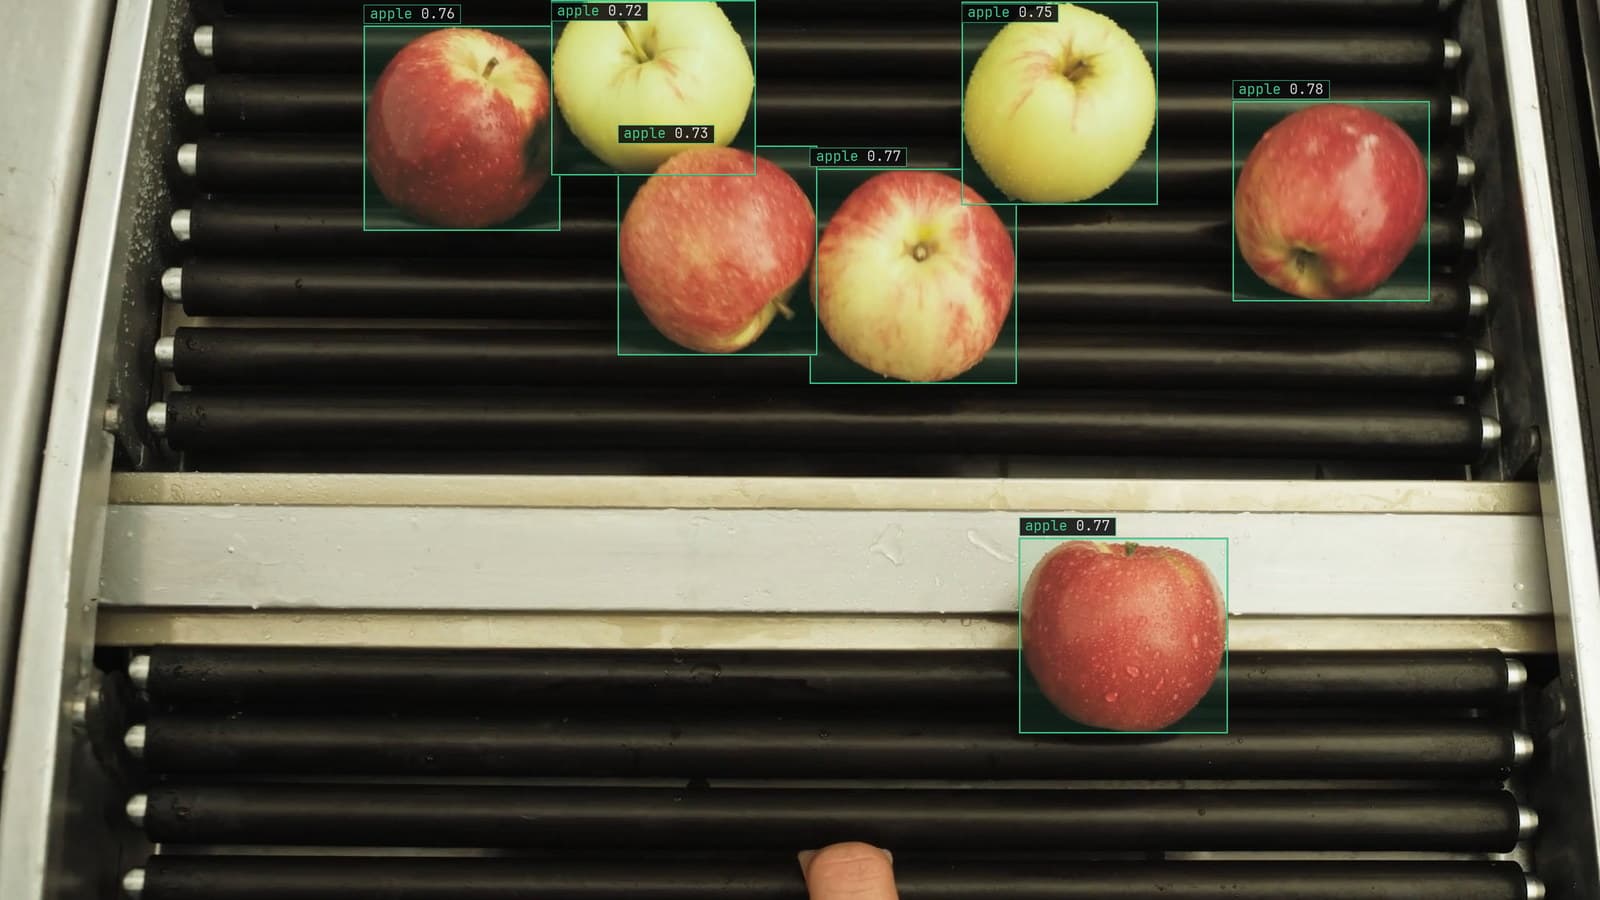
Automated sorting with computer vision, from the camera over the conveyor to the diverter
A box on every apple, a grade from the box, and an air jet that acts on it before the belt moves on. The new cultivar is when the model needs the graders again.
Rob Hickey · Sep 29, 2026